الوضع الليلي


 2:44:12
  2023-02-24
  1633
1633
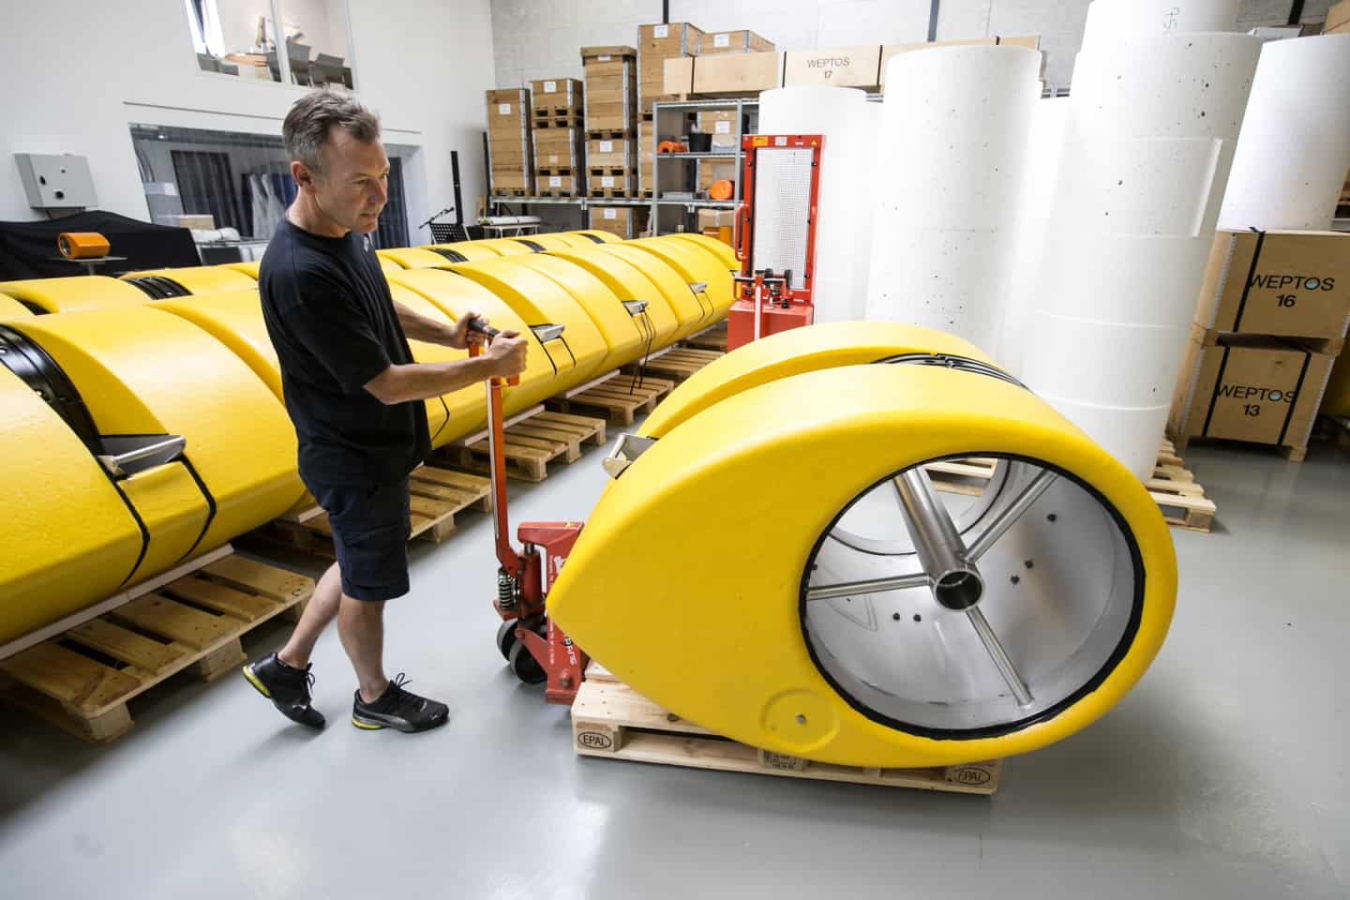
In order to design the Weptos WECs for a specific location, the wave climate must be described. The wave climate is defined as the distribution of wave characteristics over a long period of time (several years).
The main wave parameters are the significant wave height, Hs, and energy period, Te. A long record of these two statistical parameters is collected in scatter diagrams; each cell of the scatter diagram is identified by a range of Hs and Te, the sea states, and the relative probability of occurrence.
For each cell, it is then possible calculate the corresponding wave power and the probability of occurrence of the specific sea state. The scatter diagram is therefore site specific, and describes the wave climate at a specific location.
The power matrix or the efficiency curve are the characteristics of the WEC. They can be used to present the performance of a specific device in terms of efficiency, i.e., how much energy is produced for a given sea state. Depending on the stage of development, these are obtained from laboratory tests, numerical simulations or real sea trials; the more advanced the stage of development, the more reliable the power matrix or efficiency curve.
In this study, we utilize the efficiency curve of the Weptos. This was defined through laboratory tests and validated during sea trials, and describes the efficiency of the WEC (in terms of converting the power in the waves into mechanical energy at the unidirectionally rotating axle of the power take-off) as a function of the wave period, based on the active width of the rotors. When applying the efficiency curve to the real sea scale of the WEC, the wave period must be scaled according to Froude scaling, using the assumed scale of the rotor diameter.
In the following sections, the analytics of the wave energy resource is described. It must be noted that while we provide the scatter diagram at location for characterization purposes, the power production is calculated on an hourly basis (and, therefore, with a higher degree of resolution than the scatter diagram) for the period 1 September 2016 to 31 August 2017, compared to the power consumption provided directly by the Utilities, taking into account the storage capacity of the batteries, as well as backup power, when needed.
Reality Of Islam |
|
MIT researc
Researchers
Researchers
New phononi
 9:3:43
2018-11-05
9:3:43
2018-11-05
10 benefits of Marriage in Islam
7:5:22
2019-04-08
benefits of reciting surat yunus, hud &
9:45:7
2018-12-24
advantages & disadvantages of divorce
11:35:12
2018-06-10
6:0:51
2018-10-16
4:26:43
2022-02-21
12:47:1
2022-12-20
5:57:34
2023-03-18
bahlool & the throne of haroun rashid
8:20:35
2018-06-21
8:19:41
2018-06-21
8:3:0
2018-06-21
8:21:9
2018-06-21
5:41:46
2023-03-18
| LATEST |
 HOME
HOME