تاريخ الفيزياء

علماء الفيزياء


الفيزياء الكلاسيكية

الميكانيك

الديناميكا الحرارية


الكهربائية والمغناطيسية

الكهربائية

المغناطيسية

الكهرومغناطيسية


علم البصريات

تاريخ علم البصريات

الضوء

مواضيع عامة في علم البصريات

الصوت


الفيزياء الحديثة


النظرية النسبية

النظرية النسبية الخاصة

النظرية النسبية العامة

مواضيع عامة في النظرية النسبية

ميكانيكا الكم

الفيزياء الذرية

الفيزياء الجزيئية


الفيزياء النووية

مواضيع عامة في الفيزياء النووية

النشاط الاشعاعي


فيزياء الحالة الصلبة

الموصلات

أشباه الموصلات

العوازل

مواضيع عامة في الفيزياء الصلبة

فيزياء الجوامد


الليزر

أنواع الليزر

بعض تطبيقات الليزر

مواضيع عامة في الليزر


علم الفلك

تاريخ وعلماء علم الفلك

الثقوب السوداء


المجموعة الشمسية

الشمس

كوكب عطارد

كوكب الزهرة

كوكب الأرض

كوكب المريخ

كوكب المشتري

كوكب زحل

كوكب أورانوس

كوكب نبتون

كوكب بلوتو

القمر

كواكب ومواضيع اخرى

مواضيع عامة في علم الفلك

النجوم

البلازما

الألكترونيات

خواص المادة


الطاقة البديلة

الطاقة الشمسية

مواضيع عامة في الطاقة البديلة

المد والجزر

فيزياء الجسيمات


الفيزياء والعلوم الأخرى

الفيزياء الكيميائية

الفيزياء الرياضية

الفيزياء الحيوية

الفيزياء العامة


مواضيع عامة في الفيزياء

تجارب فيزيائية

مصطلحات وتعاريف فيزيائية

وحدات القياس الفيزيائية

طرائف الفيزياء

مواضيع اخرى
Saturation and Pump Beam Depletion
المؤلف:
Walter Koechner Michael Bass
المصدر:
Solid-state Lasers
الجزء والصفحة:
368
24-1-2021
1636
Saturation and Pump Beam Depletion
When the Q-switched pump pulse is incident on the nonlinear crystal, the signal and ideal waves are amplified from the initial noise level. The number of round trips in the optical cavity necessary to amplify the signal and idler waves, multiplied by the cavity round-trip time, determines the delay in achieving threshold.
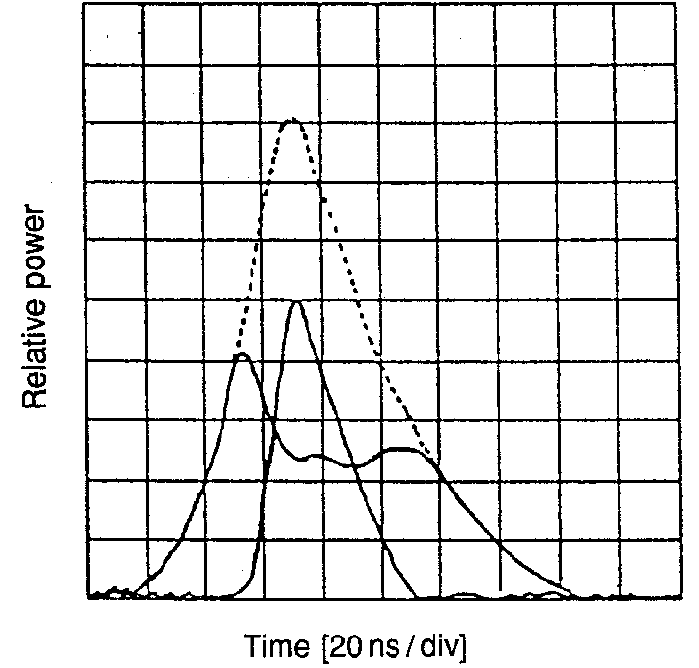
This build-up time, required to achieve parametric oscillation, causes a temporal compression of the OPO output with respect to the pump pulse. Above threshold, after a short transition period during which a steady-state condition is established, the pump power is limited at the threshold value. Any pump input power above threshold is divided into power at the signal and idler beams. Since ν3 = ν1 +ν2, it follows that for each input pump photon above threshold, one photon at the signal and idler wavelengths is generated.
The oscilloscope trace in Fig. 1, taken from the OPO, shows the dynamics of signal generation very nicely. The dashed curve is the input pump pulse. The two solid curves display the signal pulse and the depleted pump pulse at the output of the OPO. During the early part of the

FIGURE 1. Oscilloscope trace showing the depleted pump and the generated OPO output at 1.61μm (solid curves) and the input pump (dashed curve).
pump pulse, there is a transient period during which the oscillation builds up from noise. After the transient period, the pump beam is clamped at its threshold value until the pump power falls below threshold.
 الاكثر قراءة في مواضيع عامة في الليزر
 اخر الاخبار
اخبار العتبة العباسية المقدسة

الآخبار الصحية


 قسم الشؤون الفكرية يصدر كتاباً يوثق تاريخ السدانة في العتبة العباسية المقدسة
 "المهمة".. إصدار قصصي يوثّق القصص الفائزة في مسابقة فتوى الدفاع المقدسة للقصة القصيرة
 (نوافذ).. إصدار أدبي يوثق القصص الفائزة في مسابقة الإمام العسكري (عليه السلام)


