Analytical fluorimetry
The fluorescence properties of a compound are characterised by two spectra. An excitation spec trum is obtained by monitoring the fluorescence at a convenient fixed wavelength λf, while scanning the excitation monochromator at a fixed speed up to a wavelength no higher than λf. The excitation spectrum should, in principle, be comparable with the absorption spectrum. The fluorescence spectrum is obtained by illuminating the sample at a convenient fixed excitation wavelength kex and scanning the emission monochromator at a fixed speed over a wavelength range no lower than λex. Some spectrofluorimeters are able to scan the excitation and emission monochromators synchronously to yield fluorescence spectra which are generally simpler and considerably sharper than the conventional fluorescence spectrum. With computer-aided spectrofluorimetry, the acquisition and digital storage of fluorescence spectra are possible. These can then be manipulated in various ways to give the derivative spectrum (see equivalent section for UV-visible above) in which fine structure is accentuated, the difference spectrum, or multi wavelength spectral deconvolution, to calculate the concentration of known overlapping components.
In another digital technique, a series of fluorescence spectra are acquired while sequentially stepping the excitation wavelength. When these 417 Interpretation of spectra and qualitative analysis spectra are combined to give a matrix of (If, λf, λex), a three-dimensional isometric projection is presented. This type of graphic presentation is described as an ‘emission–excitation matrix’ or ‘fluorogram’ (Fig. 1). The data can also be plotted as the equivalent two-dimensional plot of isointensity contours in the (λf–λex) plane (Fig. 2). Three-dimensional graphics are increasingly used for the qualitative comparison of fluorescent molecules, as in the example of promethazine and its principal degradation product, promethazine sulfoxide (Figs 1 and 2).
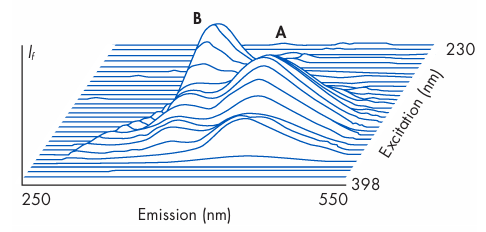
Figure 1 Isometric projection of emission–excitation matrix of fluorescence intensity (If) for promethazine hydrochloride (A) and promethazine sulfoxide (B) in buffer at pH 3.0. (From Fell et al. 1981.)
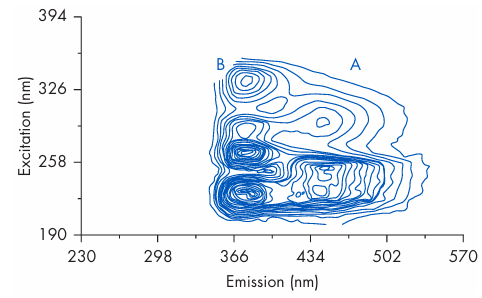
Figure 2 Contour plot of emission–excitation matrix of promethazine hydrochloride (A) and promethazine sulfoxide (B) in buffer at pH 3.0. (From Clark et al. 1985.)