LONGITUDINAL MODES
 المؤلف:
Mark Csele
 المصدر:
FUNDAMENTALS OF LIGHT SOURCES AND LASERS
 الجزء والصفحة:
p186
 17-3-2016
 1991
1991
LONGITUDINAL MODES
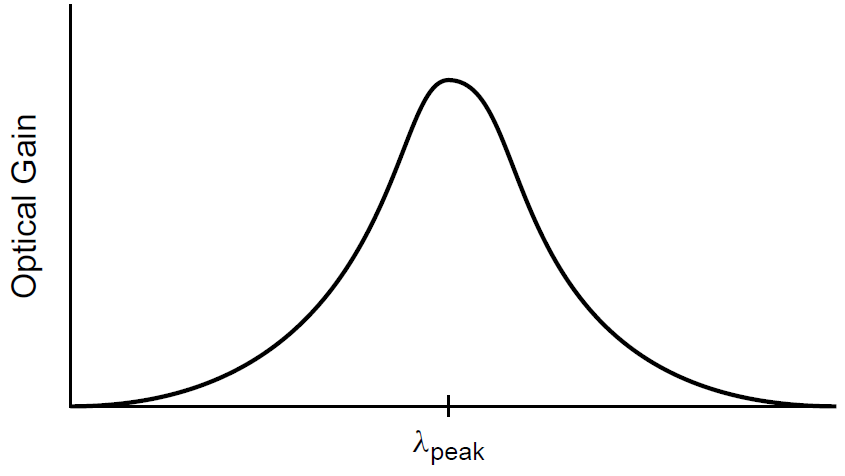
We introduced the notion of linewidth and stated that real laser gain media do not have sharp, defined wavelengths but rather, amplify over a relatively wide range. In a gas laser, Doppler broadening leads to the existence of a gain curve in which the gain of the laser (and hence the output as well) peaks at a center wavelength as shown in Figure 1.1. At all points on the gain curve where the gain is sufficient to overcome losses in the laser (and the laser cavity is resonant), the laser may oscillate and have output. We now know that the cavity itself is an interferometer and is resonant only at wavelengths spaced apart by the FSR of the

Figure 1.1. Gain curve for a practical laser.
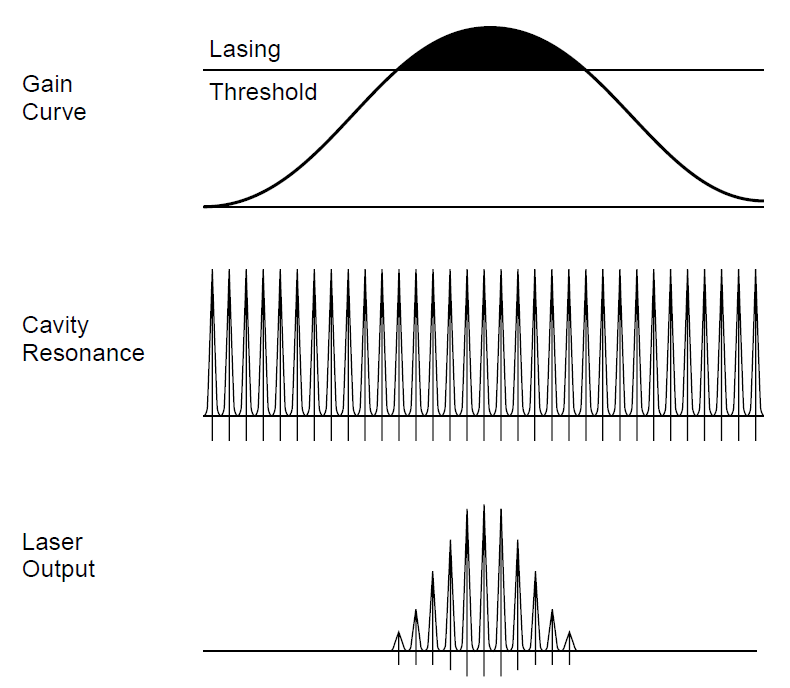
arrangement. Refining the model above, we can see that the actual output of the laser will not be a smooth curve as depicted in Figure 1.1, but rather, a series of closely spaced wavelengths which follow the general envelope of the curve and exist at points where the gain exceeds losses in the cavity. The development of the output is seen in Figure 1.2, where the top diagram shows the gain curve of the laser medium along with the lasing threshold (the point at which gain equals losses). In a simple model one would expect an output spectra resembling the shaded area on the top diagram. The response of the cavity, resonant at frequencies spaced apart by the FSR, is shown in the middle diagram. The result is depicted on the lower diagram, in which the output is seen to be several modes (11 in this case), with the strongest at the center of the curve (where the gain is highest) and the weakest near the edges, where gain just slightly exceeds losses.
Since the laser cavity is an interferometer the resonant modes of the cavity are spaced apart by free spectral range (FSR), which is defined as
 (1.1)
(1.1)
where n is the refractive index of the medium inside the cavity and l is the spacing of the cavity mirrors. The FSR, in this case, is in terms of frequency (Hz). The number of modes that will oscillate simultaneously may be determined by dividing the

Figure 1.2. Origin of longitudinal modes.
Example 1.1. Number of Modes An argon laser with a 90-cm cavity has a spectral width of 5 GHz. The FSR of the cavity is

The number of modes is then

Thirty closely spaced (167 MHz apart) modes will oscillate simultaneously. Modes at the center of the gain curve will have the highest output powers, while modes near the edge will have considerably less. Argon lasers have large line widths, due to the high operating temperatures of the plasma. Other lasers, such as He Ne lasers, have much smaller widths and hence fewer modes in the output.
 الاكثر قراءة في مواضيع عامة في الليزر
 اخر الاخبار
اخبار العتبة العباسية المقدسة


