
علم الكيمياء

تاريخ الكيمياء والعلماء المشاهير

التحاضير والتجارب الكيميائية

المخاطر والوقاية في الكيمياء

اخرى

مقالات متنوعة في علم الكيمياء

كيمياء عامة


الكيمياء التحليلية

مواضيع عامة في الكيمياء التحليلية

التحليل النوعي والكمي

التحليل الآلي (الطيفي)

طرق الفصل والتنقية


الكيمياء الحياتية

مواضيع عامة في الكيمياء الحياتية

الكاربوهيدرات

الاحماض الامينية والبروتينات

الانزيمات

الدهون

الاحماض النووية

الفيتامينات والمرافقات الانزيمية

الهرمونات


الكيمياء العضوية

مواضيع عامة في الكيمياء العضوية

الهايدروكاربونات

المركبات الوسطية وميكانيكيات التفاعلات العضوية

التشخيص العضوي

تجارب وتفاعلات في الكيمياء العضوية


الكيمياء الفيزيائية

مواضيع عامة في الكيمياء الفيزيائية

الكيمياء الحرارية

حركية التفاعلات الكيميائية

الكيمياء الكهربائية


الكيمياء اللاعضوية

مواضيع عامة في الكيمياء اللاعضوية

الجدول الدوري وخواص العناصر

نظريات التآصر الكيميائي

كيمياء العناصر الانتقالية ومركباتها المعقدة


مواضيع اخرى في الكيمياء

كيمياء النانو

الكيمياء السريرية

الكيمياء الطبية والدوائية

كيمياء الاغذية والنواتج الطبيعية

الكيمياء الجنائية


الكيمياء الصناعية

البترو كيمياويات

الكيمياء الخضراء

كيمياء البيئة

كيمياء البوليمرات

مواضيع عامة في الكيمياء الصناعية

الكيمياء الاشعاعية والنووية
Pulsed Fourier Transform Spectroscopy
المؤلف:
William Reusch
المصدر:
Virtual Textbook of Organic Chemistry
الجزء والصفحة:
............
13-8-2018
1549
Pulsed Fourier Transform Spectroscopy

In a given strong external magnetic field, each structurally distinct set of hydrogens in a molecule has a characteristic resonance frequency, just as each tubular chime in percussion instrument has a characteristic frequency. The drawing on the right depicts a set of four chimes, with the frequency of each designated by a colored sine wave. To discover the frequency of a chime we can strike it with a mallet and measure the sound emitted. This procedure can be repeated for each chime in the group so that all the characteristic frequencies are identified. The button beneath the drawing activates an animation showing this for one chime. Clicking on the illustration returns the original drawing.
An alternative means of acquiring the same information is to strike all the chimes simultaneously, and to subject the complex collection of frequencies produced to mathematical analysis. In the following diagram the four frequencies assigned to our set of chimes are added together to give a complex summation wave. This is a straightforward conversion; and the reverse transformation, while not as simple, is readily accomplished, provided the combination signal is adequately examined and characterized..

A CW nmr spectrometer functions by irradiating each set of distinct nuclei in turn, a process analagous to striking each chime independently. For a high resolution spectrum this must be done slowly, and a 12 ppm sweep of the proton region takes from 5 to 10 minutes. It has proven much more efficient to excite all the proton nuclei in a molecule at the same time, followed by mathematical analysis of the complex rf resonance frequencies emitted as they relax back to the equilibrium state. This is the principle on which a pulse Fourier transform spectrometer operates. By exposing the sample to a very short (10 to 100 μsec), relatively strong (about 10,000 times that used for a CW spectrometer) burst of rf energy along the x-axis, as described above, all of the protons in the sample are excited simultaneously. The macroscopic magnetization model remains useful if we recognize it is a combination of magnetization vectors for all the nuclei that have been excited.

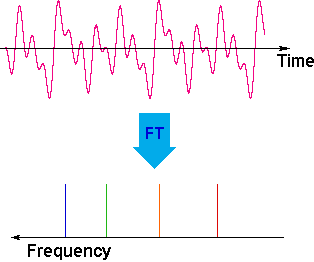
The overlapping resonance signals generated as the excited protons relax are collected by a computer and subjected to a Fourier transform mathematical analysis. As shown in the diagram on the left, the Fourier transform analysis, abbreviated FT, converts the complex time domain signal emitted by the sample into the frequency (or field) domain spectrum we are accustomed to seeing. In this fashion a complete spectrum can be acquired in a few seconds.
Because the relaxation mechanism is a first order process, the rf signal emitted by the sample decays exponentially. This is called a free induction decay signal, abbreviated FID. An example of a FID signal may be seen by .
Since, the FID signal collected after one pulse, may be stored and averaged with the FID's from many other identical pulses prior to the Fourier transform, the nmr signal strength from a small sample may be enhanced to provide a useable spectrum. This has been essential to acquiring spectra from low abundance isotopes, such as 13C. In practice, the pulse FT experiment has proven so versatile that many variations of the technique, suited to special purposes, have been devised and used effectively.
 الاكثر قراءة في التشخيص العضوي
 اخر الاخبار
اخبار العتبة العباسية المقدسة

الآخبار الصحية


 قسم الشؤون الفكرية يصدر كتاباً يوثق تاريخ السدانة في العتبة العباسية المقدسة
 "المهمة".. إصدار قصصي يوثّق القصص الفائزة في مسابقة فتوى الدفاع المقدسة للقصة القصيرة
 (نوافذ).. إصدار أدبي يوثق القصص الفائزة في مسابقة الإمام العسكري (عليه السلام)


