النبات

مواضيع عامة في علم النبات
الجذور - السيقان - الأوراق
النباتات الوعائية واللاوعائية
البذور (مغطاة البذور - عاريات البذور)
الطحالب
النباتات الطبية
الحيوان
مواضيع عامة في علم الحيوان
علم التشريح
التنوع الإحيائي
البايلوجيا الخلوية
الأحياء المجهرية
البكتيريا
الفطريات
الطفيليات
الفايروسات
علم الأمراض
الاورام
الامراض الوراثية
الامراض المناعية
الامراض المدارية
اضطرابات الدورة الدموية
مواضيع عامة في علم الامراض
الحشرات
التقانة الإحيائية
مواضيع عامة في التقانة الإحيائية
التقنية الحيوية المكروبية
التقنية الحيوية والميكروبات
الفعاليات الحيوية
وراثة الاحياء المجهرية
تصنيف الاحياء المجهرية
الاحياء المجهرية في الطبيعة
أيض الاجهاد
التقنية الحيوية والبيئة
التقنية الحيوية والطب
التقنية الحيوية والزراعة
التقنية الحيوية والصناعة
التقنية الحيوية والطاقة
البحار والطحالب الصغيرة
عزل البروتين
هندسة الجينات
التقنية الحياتية النانوية
مفاهيم التقنية الحيوية النانوية
التراكيب النانوية والمجاهر المستخدمة في رؤيتها
تصنيع وتخليق المواد النانوية
تطبيقات التقنية النانوية والحيوية النانوية
الرقائق والمتحسسات الحيوية
المصفوفات المجهرية وحاسوب الدنا
اللقاحات
البيئة والتلوث
علم الأجنة
اعضاء التكاثر وتشكل الاعراس
الاخصاب
التشطر
العصيبة وتشكل الجسيدات
تشكل اللواحق الجنينية
تكون المعيدة وظهور الطبقات الجنينية
مقدمة لعلم الاجنة
الأحياء الجزيئي
مواضيع عامة في الاحياء الجزيئي
علم وظائف الأعضاء
الغدد
مواضيع عامة في الغدد
الغدد الصم و هرموناتها
الجسم تحت السريري
الغدة النخامية
الغدة الكظرية
الغدة التناسلية
الغدة الدرقية والجار الدرقية
الغدة البنكرياسية
الغدة الصنوبرية
مواضيع عامة في علم وظائف الاعضاء
الخلية الحيوانية
الجهاز العصبي
أعضاء الحس
الجهاز العضلي
السوائل الجسمية
الجهاز الدوري والليمف
الجهاز التنفسي
الجهاز الهضمي
الجهاز البولي
المضادات الميكروبية
مواضيع عامة في المضادات الميكروبية
مضادات البكتيريا
مضادات الفطريات
مضادات الطفيليات
مضادات الفايروسات
علم الخلية
الوراثة
الأحياء العامة
المناعة
التحليلات المرضية
الكيمياء الحيوية
مواضيع متنوعة أخرى
الانزيمات

Lineweaver-Burk plot
 المؤلف:
Denise R. Ferrier
المؤلف:
Denise R. Ferrier
 المصدر:
Lippincott Illustrated Reviews: Biochemistry
المصدر:
Lippincott Illustrated Reviews: Biochemistry
 الجزء والصفحة:
 6-9-2021
 2682
2682


+
-
20
Lineweaver-Burk plot
When vo is plotted against [S], it is not always possible to determine when Vmax has been achieved because of the gradual upward slope of the hyperbolic curve at high substrate concentrations. However, if 1/vo is plotted versus 1/[S], a straight line is obtained (Fig. 1). This plot, the Lineweaver-Burk plot (also called a double-reciprocal plot) can be used to calculate Km and Vmax as well as to determine the mechanism of action of enzyme inhibitors.
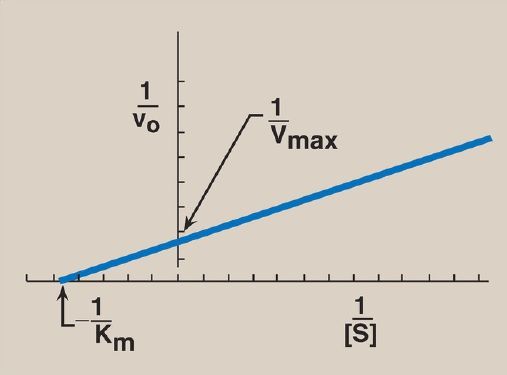
Figure 1 Lineweaver-Burk plot. vo = initial reaction velocity; Vmax = maximal velocity; Km = Michaelis constant; [S] = substrate concentration.
The equation describing the Lineweaver-Burk plot is:

where the intercept on the x axis is equal to − 1/Km, and the intercept on the y axis is equal to 1/Vmax. [Note: The slope = Km/Vmax.]
 الاكثر قراءة في الكيمياء الحيوية
 اخر الاخبار
اخبار العتبة العباسية المقدسة

الآخبار الصحية


مواضيع ذات صلة
 قسم الشؤون الفكرية يصدر كتاباً يوثق تاريخ السدانة في العتبة العباسية المقدسة
 "المهمة".. إصدار قصصي يوثّق القصص الفائزة في مسابقة فتوى الدفاع المقدسة للقصة القصيرة
 (نوافذ).. إصدار أدبي يوثق القصص الفائزة في مسابقة الإمام العسكري (عليه السلام)