Chemical-Shift Effects on Spin-Spin Splitting
 المؤلف:
John D. Roberts and Marjorie C. Caserio
 المصدر:
Basic Principles of Organic Chemistry : LibreTexts project
 الجزء والصفحة:
........
 12-1-2022
 2297
2297
Chemical-Shift Effects on Spin-Spin Splitting
The simple n+1 rule for predicting the multiplicity of spin-coupled proton signals often breaks down whenever the chemical-shift difference between the protons in different groups becomes comparable to coupling constants for magnetic interaction between the groups. Under these circumstances, you may expect to see more lines, or lines in different positions with different intensities, than predicted from the simple first-order treatment. One example is the effect of changing chemical shift on a two-proton spectrum with J=10Hz (Figure 9-44).
We see in Figure 9-44 that even when the shift is 7.5 times larger than the coupling, the outside lines are weaker than the inside lines. This general kind of asymmetry of line intensities also is apparent in the spectrum of ethyl iodide (Figure 9-32), in which the lines of each group are more like 0.7:2.5:3.5:1.3 and 1.2:2.0:0.8, rather than the 1:3:3:1 and 1:2:1 ratios predicted from the first-order treatment. The asymmetry is such that two groups of lines that are connected by spin-spin splitting in effect "point" to one another - the lines on the "inside" of the pattern are stronger than predicted from the first-order treatment, whereas those on the "outside" are weaker. The effect can be put to practical use, as illustrated in the following exercise.

Figure 9-44: Representation of the changes in line positions and intensities for a two-proton system with a coupling constant, J, of 10Hz and the indicated chemical-shift differences. Only a single sharp line is observed if the shift difference is zero.
To explain the effect of chemical shifts on second-order splitting is beyond the scope of this book. But regardless of how many lines appear in a complex nmr spectrum, they can be rationalized in terms of the chemical shifts, coupling constants, and exchange effects. Furthermore, the overall signal intensities remain proportional to the number of protons giving rise to the signals.
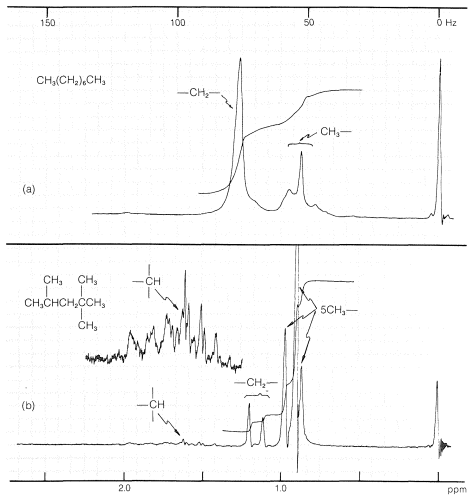
When there are many hydrogens and small chemical-shift differences, as in alkanes, the proton nmr spectra may have so many closely spaced resonance lines that they merge together to give a series of smooth, more-or-less featureless peaks. The proton spectrum of octane (Figure 9-46a) is an excellent example of this type of spectrum. Useful information often can be obtained from such spectra as to the ratio of CH3 : CH2 : CH by investigation of the integrals over the range of alkane proton absorptions. Figure 9-46 illustrates how this can be done for octane and 2,2,4-trimethylpentane.

 الاكثر قراءة في التشخيص العضوي
 اخر الاخبار
اخبار العتبة العباسية المقدسة


