


 الفيزياء الكلاسيكية
 الكهربائية والمغناطيسية
 علم البصريات
 الفيزياء الحديثة
 النظرية النسبية
 الفيزياء النووية
 فيزياء الحالة الصلبة
 الليزر
 علم الفلك
 المجموعة الشمسية
 الطاقة البديلة
 الفيزياء والعلوم الأخرى
 مواضيع عامة في الفيزياء
|
أقرأ أيضاً
التاريخ: 21-11-2019
التاريخ: 28-11-2019
التاريخ: 16-6-2016
التاريخ: 9-12-2020
|
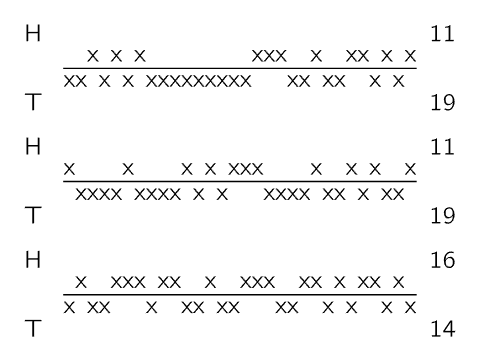
Fig. 6–1. Observed sequences of heads and tails in three games of 30 tosses each.
We would like to use our ideas about probability to consider in some greater detail the question: “How many heads do I really expect to get if I toss a coin N times?” Before answering the question, however, let us look at what does happen in such an “experiment.” Figure 6–1 shows the results obtained in the first three “runs” of such an experiment in which N=30. The sequences of “heads” and “tails” are shown just as they were obtained. The first game gave 11 heads; the second also 11; the third 16. In three trials we did not once get 15 heads. Should we begin to suspect the coin? Or were we wrong in thinking that the most likely number of “heads” in such a game is 15? Ninety-seven more runs were made to obtain a total of 100 experiments of 30 tosses each. The results of the experiments are given in Table 6–1.1
Table 6–1
Number of heads in successive trials of 30 tosses of a coin.
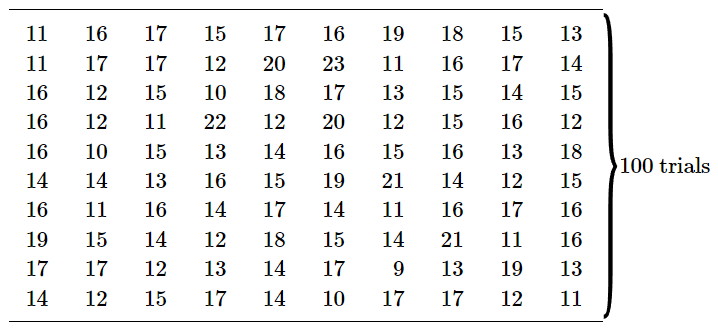
Looking at the numbers in Table 6–1, we see that most of the results are “near” 15, in that they are between 12 and 18. We can get a better feeling for the details of these results if we plot a graph of the distribution of the results. We count the number of games in which a score of k was obtained, and plot this number for each k. Such a graph is shown in Fig. 6–2. A score of 15 heads was obtained in 13 games. A score of 14 heads was also obtained 13 times. Scores of 16 and 17 were each obtained more than 13 times. Are we to conclude that there is some bias toward heads? Was our “best estimate” not good enough? Should we conclude now that the “most likely” score for a run of 30 tosses is really 16 heads? But wait! In all the games taken together, there were 3000 tosses. And the total number of heads obtained was 1493. The fraction of tosses that gave heads is 0.498, very nearly, but slightly less than half. We should certainly not assume that the probability of throwing heads is greater than 0.5! The fact that one particular set of observations gave 16 heads most often, is a fluctuation. We still expect that the most likely number of heads is 15.
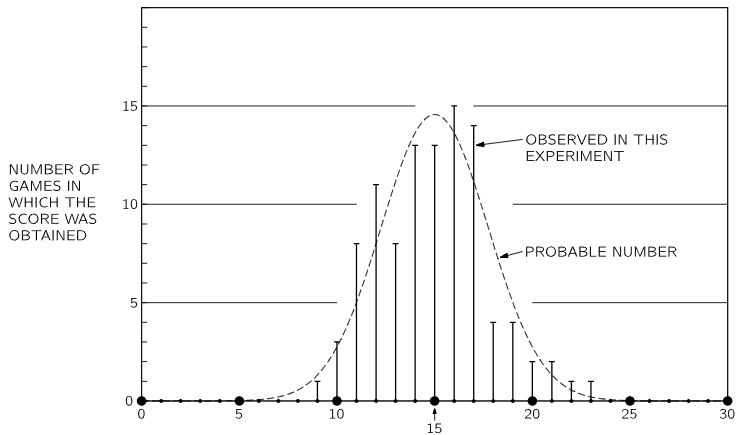
Fig. 6–2. Summary of the results of 100 games of 30 tosses each. The vertical bars show the number of games in which a score of k heads was obtained. The dashed curve shows the expected numbers of games with the score k obtained by a probability computation.
We may ask the question: “What is the probability that a game of 30 tosses will yield 15 heads—or 16, or any other number?” We have said that in a game of one toss, the probability of obtaining one head is 0.5, and the probability of obtaining no head is 0.5. In a game of two tosses there are four possible outcomes: HH, HT, TH, TT. Since each of these sequences is equally likely, we conclude that (a) the probability of a score of two heads is 1/4, (b) the probability of a score of one head is 2/4, (c) the probability of a zero score is 1/4. There are two ways of obtaining one head, but only one of obtaining either zero or two heads.
Consider now a game of 3 tosses. The third toss is equally likely to be heads or tails. There is only one way to obtain 3 heads: we must have obtained 2 heads on the first two tosses, and then heads on the last. There are, however, three ways of obtaining 2 heads. We could throw tails after having thrown two heads (one way) or we could throw heads after throwing only one head in the first two tosses (two ways). So for scores of 3-H, 2-H, 1-H, 0-H we have that the number of equally likely ways is 1, 3, 3, 1, with a total of 8 different possible sequences. The probabilities are 1/8, 3/8, 3/8, 1/8.
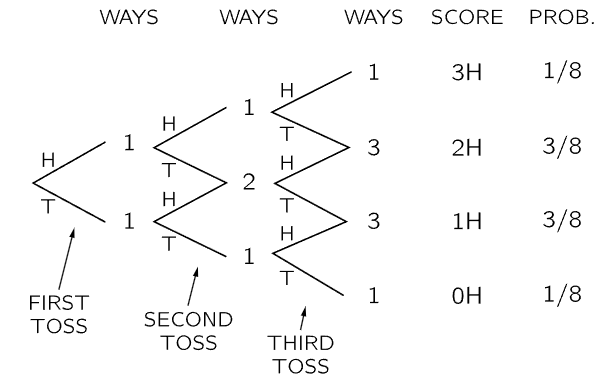
Fig. 6–3. A diagram for showing the number of ways a score of 0, 1, 2, or 3 heads can be obtained in a game of 3 tosses.
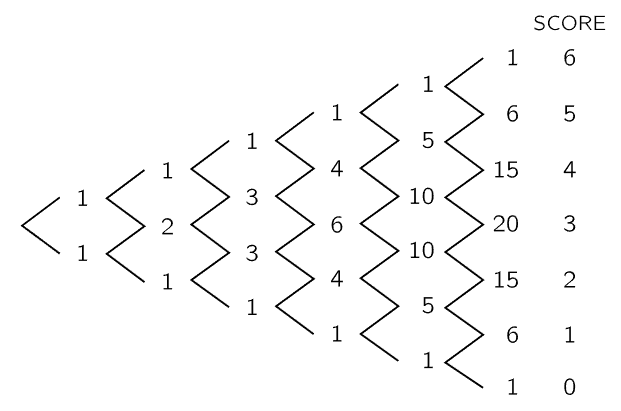
Fig. 6–4. A diagram like that of Fig. 6–3, for a game of 6 tosses.
The argument we have been making can be summarized by a diagram like that in Fig. 6–3. It is clear how the diagram should be continued for games with a larger number of tosses. Figure 6–4 shows such a diagram for a game of 6 tosses. The number of “ways” to any point on the diagram is just the number of different “paths” (sequences of heads and tails) which can be taken from the starting point. The vertical position gives us the total number of heads thrown. The set of numbers which appears in such a diagram is known as Pascal’s triangle. The numbers are also known as the binomial coefficients, because they also appear in the expansion of (a+b)n. If we call n the number of tosses and k the number of heads thrown, then the numbers in the diagram are usually designated by the symbol  . We may remark in passing that the binomial coefficients can also be computed from

where n!, called “n-factorial,” represents the product (n)(n−1)(n−2)⋯(3)(2)(1).
We are now ready to compute the probability P(k,n) of throwing k heads in n tosses, using our definition Eq. (6.1). The total number of possible sequences is 2n (since there are 2 outcomes for each toss), and the number of ways of obtaining k heads is  , all equally likely, so we have

Since P(k,n) is the fraction of games which we expect to yield k heads, then in 100 games we should expect to find k heads 100⋅P(k,n) times. The dashed curve in Fig. 6–2 passes through the points computed from 100⋅P(k,30). We see that we expect to obtain a score of 15 heads in 14 or 15 games, whereas this score was observed in 13 games. We expect a score of 16 in 13 or 14 games, but we obtained that score in 15 games. Such fluctuations are “part of the game.”
The method we have just used can be applied to the most general situation in which there are only two possible outcomes of a single observation. Let us designate the two outcomes by W (for “win”) and L (for “lose”). In the general case, the probability of W or L in a single event need not be equal. Let p be the probability of obtaining the result W. Then q, the probability of L, is necessarily (1−p). In a set of n trials, the probability P(k,n) that W will be obtained k times is

This probability function is called the Bernoulli or, also, the binomial probability.
___________________________________________________
margin
1- After the first three games, the experiment was actually done by shaking 30 pennies violently in a box and then counting the number of heads that showed.


|
|
|
|
دراسة تحدد أفضل 4 وجبات صحية.. وأخطرها
|
|
|
|
|
|
|
العتبة العباسية تحتفي بذكرى ولادة الإمام الجواد (عليه السلام) في مشاتل الكفيل
|
|
|