

 الفيزياء الكلاسيكية
 الكهربائية والمغناطيسية
 علم البصريات
 الفيزياء الحديثة
 النظرية النسبية
 الفيزياء النووية
 فيزياء الحالة الصلبة
 الليزر
 علم الفلك
 المجموعة الشمسية
 الطاقة البديلة
 الفيزياء والعلوم الأخرى
 مواضيع عامة في الفيزياء
|
أقرأ أيضاً
التاريخ: 2023-04-19
التاريخ: 2023-04-26
التاريخ: 2023-05-22
التاريخ: 2023-04-25
|
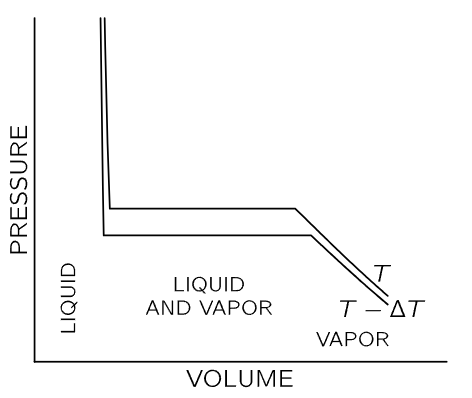
The vaporization of a liquid is another application of the results we have derived. Suppose we have some liquid in a cylinder, such that we can compress it by pushing on the piston, and we ask ourselves, “If we keep the temperature constant, how does the pressure vary with volume?” In other words, we want to draw an isothermal line on the P-V diagram. The substance in the cylinder is not the ideal gas that we considered earlier; now it may be in the liquid or the vapor phase, or both may be present. If we apply sufficient pressure, the substance will condense to a liquid. Now if we squeeze still harder, the volume changes very little, and our isothermal line rises rapidly with decreasing volume, as shown at the left in Fig. 45–3.

Fig. 45–3. Isothermal lines for a condensable vapor compressed in a cylinder. At the left, the substance is in the liquid phase. At the right, the substance is vaporized. In the center, both liquid and vapor are present in the cylinder.
If we increase the volume by pulling the piston out, the pressure drops until we reach the point at which the liquid starts to boil, and then vapor starts to form. If we pull the piston out farther, all that happens is that more liquid vaporizes. When there is part liquid and part vapor in the cylinder, the two phases are in equilibrium—liquid is evaporating and vapor is condensing at the same rate. If we make more room for the vapor, more vapor is needed to maintain the pressure, so a little more liquid evaporates, but the pressure remains constant. On the flat part of the curve in Fig. 45–3 the pressure does not change, and the value of the pressure here is called the vapor pressure at temperature T. As we continue to increase the volume, there comes a time when there is no more liquid to evaporate. At this juncture, if we expand the volume further, the pressure will fall as for an ordinary gas, as shown at the right of the P-V diagram. The lower curve in Fig. 45–3 is the isothermal line at a slightly lower temperature T−ΔT. The pressure in the liquid phase is slightly reduced because liquid expands with an increase in temperature (for most substances, but not for water near the freezing point) and, of course, the vapor pressure is lower at the lower temperature.

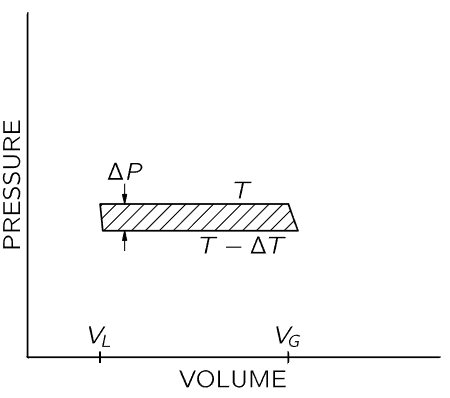
Fig. 45–4. Pressure-volume diagram for a Carnot cycle with a condensable vapor in the cylinder. At the left, the substance is in the liquid state. A quantity of heat L is added at temperature T to vaporize the liquid. The vapor expands adiabatically as T changes to T−ΔT.
We will now make a cycle out of the two isothermal lines by connecting them (say by adiabatic lines) at both ends of the upper flat section, as shown in Fig. 45–4. We are going to use the argument of Carnot, which tells us that the heat added to the substance in changing it from a liquid to a vapor is related to the work done by the substance as it goes around the cycle. Let us call L the heat needed to vaporize the substance in the cylinder. As in the argument immediately preceding Eq. (45.5), we know that L(ΔT/T)=work done by the substance. As before, the work done by the substance is the shaded area, which is approximately ΔP(VG−VL), where ΔP is the difference in vapor pressure at the two temperatures T and T−ΔT, VG is the volume of the gas, and VL is the volume of the liquid, both volumes measured at the vapor pressure at temperature T. Setting these two expressions for the area equal, we get LΔT/T=ΔP(VG−VL), or

Equation (45.14) gives the relationship between the rate of change of vapor pressure with temperature and the amount of heat required to evaporate the liquid. This relationship was deduced by Carnot, but it is called the Clausius-Clapeyron equation.
Now let us compare Eq. (45.14) with the results deduced from kinetic theory. Usually VG is very much larger than VL. So VG−VL≈VG=RT/P per mole. If we further assume that L is a constant, independent of temperature—not a very good approximation—then we would have ∂P/∂T=L/(RT2/P). The solution of this differential equation is

Let us compare this with the pressure variation with temperature that we deduced earlier from kinetic theory. Kinetic theory indicated the possibility, at least roughly, that the number of molecules per unit volume of vapor above a liquid would be

where UG−UL is the internal energy per mole in the gas minus the internal energy per mole in the liquid, i.e., the energy needed to vaporize a mole of liquid. Equation (45.15) from thermodynamics and Eq. (45.16) from kinetic theory are very closely related because the pressure is nkT, but they are not exactly the same. However, they will turn out to be exactly the same if we assume UG−UL=const, instead of L=const. If we assume UG−UL=const, independent of temperature, then the argument leading to Eq. (45.15) will produce Eq. (45.16). Since the pressure is constant while the volume is changing, the change in internal energy UG−UL is equal to the heat L put in minus the work done P(VG−VL), so L=(UG+PVG)−(UL+PVL).
This comparison shows the advantages and disadvantages of thermodynamics over kinetic theory: First of all, Eq. (45.14) obtained by thermodynamics is exact, while Eq. (45.16) can only be approximated, for instance, if U is nearly constant, and if the model is right. Second, we may not understand correctly how the gas goes into the liquid; nevertheless, Eq. (45.14) is right, while (45.16) is only approximate. Third, although our treatment applies to a gas condensing into a liquid, the argument is true for any other change of state. For instance, the solid-to-liquid transition has the same kind of curve as that shown in Figs. 45–3 and 45–4. Introducing the latent heat for melting, M/mole, the formula analogous to Eq. (45.14) then is (∂Pmelt/∂T)V=M/[T(Vliq−Vsolid)]. Although we may not understand the kinetic theory of the melting process, we nevertheless have a correct equation. However, when we can understand the kinetic theory, we have another advantage. Equation (45.14) is only a differential relationship, and we have no way of obtaining the constants of integration. In the kinetic theory we can obtain the constants also if we have a good model that describes the phenomenon completely. So there are advantages and disadvantages to each. When knowledge is weak and the situation is complicated, thermodynamic relations are really the most powerful. When the situation is very simple and a theoretical analysis can be made, then it is better to try to get more information from theoretical analysis.
One more example: blackbody radiation. We have discussed a box containing radiation and nothing else. We have talked about the equilibrium between the oscillator and the radiation. We also found that the photons hitting the wall of the box would exert the pressure P, and we found PV=U/3, where U is the total energy of all the photons and V is the volume of the box. If we substitute U=3PV in the basic Eq. (45.7), we find 1

Since the volume of our box is constant, we can replace (∂P/∂T)V by dP/dT to obtain an ordinary differential equation we can integrate: lnP=4lnT+const, or P=const×T4. The pressure of radiation varies as the fourth power of the temperature, and the total energy density of the radiation, U/V=3P, also varies as T4. It is usual to write U/V=(4σ/c)T4, where c is the speed of light and σ is called the Stefan-Boltzmann constant. It is not possible to get σ from thermodynamics alone. Here is a good example of its power, and its limitations. To know that U/V goes as T4 is a great deal, but to know how big U/V actually is at any temperature requires that we go into the kind of detail that only a complete theory can supply. For blackbody radiation we have such a theory and we can derive an expression for the constant σ in the following manner.
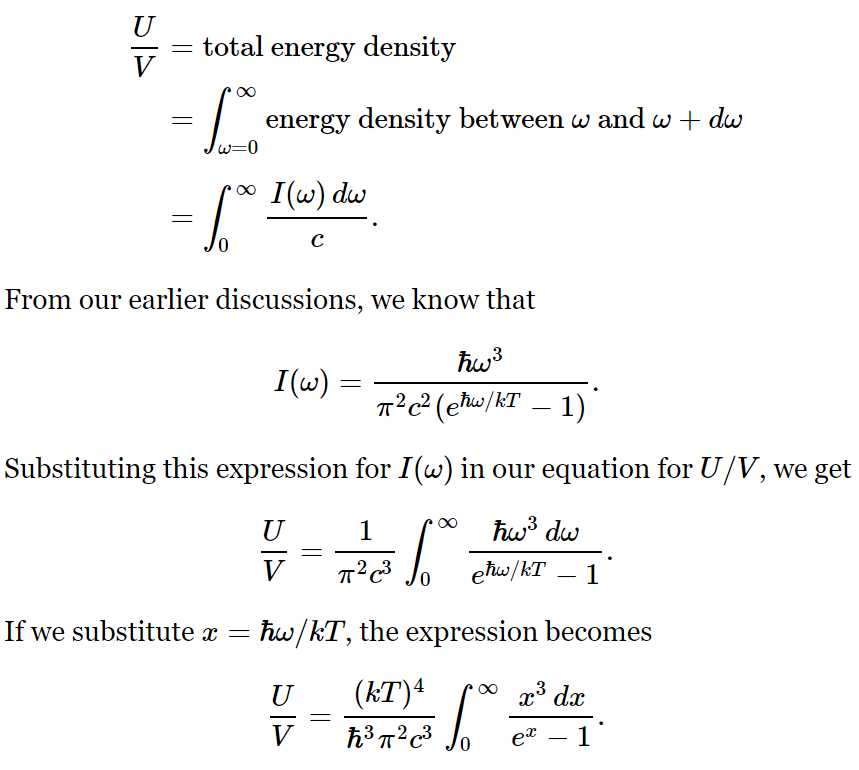
Let I(ω)dω be the intensity distribution, the energy flow through 1 m² in one second with frequency between ω and ω+dω. The energy density distribution= energy/volume=I(ω)dω/c is

This integral is just some number that we can get, approximately, by drawing a curve and taking the area by counting squares. It is roughly 6.5. The mathematicians among us can show that the integral is exactly π4/15. 2 Comparing this expression with U/V=(4σ/c)T4, we find

If we make a small hole in our box, how much energy will flow per second through the hole of unit area? To go from energy density to energy flow, we multiply the energy density U/V by c. We also multiply by 1/4, which arises as follows: first, a factor of 1/2, because only the energy which is flowing out escapes; and second, another factor 1/2, because energy which approaches the hole at an angle to the normal is less effective in getting through the hole by a cosine factor. The average value of the cosine factor is 1/2. It is clear now why we write U/V=(4σ/c)T4: so that we can ultimately say that the flux from a small hole is σT4 per unit area.
_____________________________________________________
Margins
1. In this case (∂P/∂V)T=0, because in order to keep the oscillator in equilibrium at a given temperature, the radiation in the neighborhood of the oscillator has to be the same, regardless of the volume of the box. The total quantity of photons inside the box must therefore be proportional to its volume, so the internal energy per unit volume, and thus the pressure, depends only on the temperature.
2- Since (ex−1)−1=e−x+e−2x+⋯(


|
|
|
|
التوتر والسرطان.. علماء يحذرون من "صلة خطيرة"
|
|
|
|
|
|
|
مرآة السيارة: مدى دقة عكسها للصورة الصحيحة
|
|
|
|
|
|
|
دراسة تستعرض آلام السجناء السياسيين في حقبة البعث المجرم في العراق
|
|
|