النبات

مواضيع عامة في علم النبات
الجذور - السيقان - الأوراق
النباتات الوعائية واللاوعائية
البذور (مغطاة البذور - عاريات البذور)
الطحالب
النباتات الطبية
الحيوان
مواضيع عامة في علم الحيوان
علم التشريح
التنوع الإحيائي
البايلوجيا الخلوية
الأحياء المجهرية
البكتيريا
الفطريات
الطفيليات
الفايروسات
علم الأمراض
الاورام
الامراض الوراثية
الامراض المناعية
الامراض المدارية
اضطرابات الدورة الدموية
مواضيع عامة في علم الامراض
الحشرات
التقانة الإحيائية
مواضيع عامة في التقانة الإحيائية
التقنية الحيوية المكروبية
التقنية الحيوية والميكروبات
الفعاليات الحيوية
وراثة الاحياء المجهرية
تصنيف الاحياء المجهرية
الاحياء المجهرية في الطبيعة
أيض الاجهاد
التقنية الحيوية والبيئة
التقنية الحيوية والطب
التقنية الحيوية والزراعة
التقنية الحيوية والصناعة
التقنية الحيوية والطاقة
البحار والطحالب الصغيرة
عزل البروتين
هندسة الجينات
التقنية الحياتية النانوية
مفاهيم التقنية الحيوية النانوية
التراكيب النانوية والمجاهر المستخدمة في رؤيتها
تصنيع وتخليق المواد النانوية
تطبيقات التقنية النانوية والحيوية النانوية
الرقائق والمتحسسات الحيوية
المصفوفات المجهرية وحاسوب الدنا
اللقاحات
البيئة والتلوث
علم الأجنة
اعضاء التكاثر وتشكل الاعراس
الاخصاب
التشطر
العصيبة وتشكل الجسيدات
تشكل اللواحق الجنينية
تكون المعيدة وظهور الطبقات الجنينية
مقدمة لعلم الاجنة
الأحياء الجزيئي
مواضيع عامة في الاحياء الجزيئي
علم وظائف الأعضاء
الغدد
مواضيع عامة في الغدد
الغدد الصم و هرموناتها
الجسم تحت السريري
الغدة النخامية
الغدة الكظرية
الغدة التناسلية
الغدة الدرقية والجار الدرقية
الغدة البنكرياسية
الغدة الصنوبرية
مواضيع عامة في علم وظائف الاعضاء
الخلية الحيوانية
الجهاز العصبي
أعضاء الحس
الجهاز العضلي
السوائل الجسمية
الجهاز الدوري والليمف
الجهاز التنفسي
الجهاز الهضمي
الجهاز البولي
المضادات الميكروبية
مواضيع عامة في المضادات الميكروبية
مضادات البكتيريا
مضادات الفطريات
مضادات الطفيليات
مضادات الفايروسات
علم الخلية
الوراثة
الأحياء العامة
المناعة
التحليلات المرضية
الكيمياء الحيوية
مواضيع متنوعة أخرى
الانزيمات

GRAPHICAL ANALYSIS OF VENTRICULAR PUMPING
 المؤلف:
John E. Hall, PhD
المؤلف:
John E. Hall, PhD
 المصدر:
Guyton and Hall Textbook of Medical Physiology
المصدر:
Guyton and Hall Textbook of Medical Physiology
 الجزء والصفحة:
13th Edition , p117
الجزء والصفحة:
13th Edition , p117
 2025-02-24
 833
833


+
-
20
Figure 1 shows a diagram that is especially useful in explaining the pumping mechanics of the left ventricle. The most important components of the diagram are the two curves labeled “diastolic pressure” and “systolic pressure.” These curves are volume-pressure curves.
The diastolic pressure curve is determined by filling the heart with progressively greater volumes of blood and then measuring the diastolic pressure immediately before ventricular contraction occurs, which is the end-diastolic pressure of the ventricle.
The systolic pressure curve is determined by recording the systolic pressure achieved during ventricular contraction at each volume of filling.
Until the volume of the noncontracting ventricle rises above about 150 milliliters, the “diastolic” pressure does not increase greatly. Therefore, up to this volume, blood can flow easily into the ventricle from the atrium. Above 150 milliliters, the ventricular diastolic pressure increases rapidly, partly because of fibrous tissue in the heart that will stretch no more and partly because the pericardium that surrounds the heart becomes filled nearly to its limit.
During ventricular contraction, the systolic pressure increases even at low ventricular volumes and reaches a maximum at a ventricular volume of 150 to 170 milliliters. Then, as the volume increases still further, the systolic pressure actually decreases under some conditions, as demonstrated by the falling systolic pressure curve in Figure 1, because at these great volumes, the actin and myosin filaments of the cardiac muscle fibers are pulled apart far enough that the strength of each cardiac fiber contraction becomes less than optimal.
Note especially in the figure that the maximum systolic pressure for the normal left ventricle is between 250 and 300 mm Hg, but this varies widely with each person’s heart strength and degree of heart stimulation by cardiac nerves. For the normal right ventricle, the maximum systolic pressure is between 60 and 80 mm Hg.
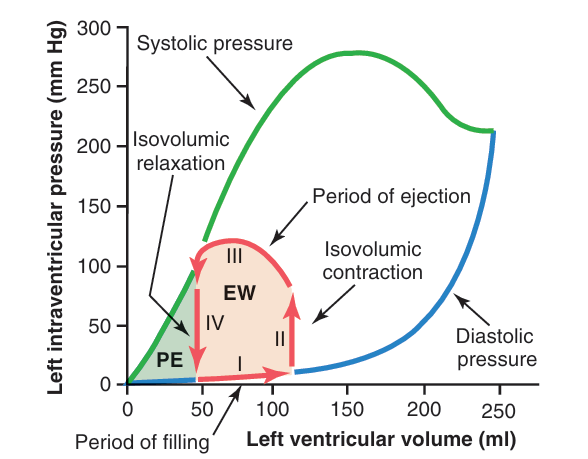
Fig1. Relationship between left ventricular volume and intra ventricular pressure during diastole and systole. Also shown by the red lines is the “volume-pressure diagram,” demonstrating changes in intraventricular volume and pressure during the normal cardiac cycle. EW, net external work; PE, potential energy.
 الاكثر قراءة في الجهاز الدوري والليمف
 اخر الاخبار
اخبار العتبة العباسية المقدسة

الآخبار الصحية


مواضيع ذات صلة
 قسم الشؤون الفكرية يصدر كتاباً يوثق تاريخ السدانة في العتبة العباسية المقدسة
 "المهمة".. إصدار قصصي يوثّق القصص الفائزة في مسابقة فتوى الدفاع المقدسة للقصة القصيرة
 (نوافذ).. إصدار أدبي يوثق القصص الفائزة في مسابقة الإمام العسكري (عليه السلام)