

النبات

مواضيع عامة في علم النبات

الجذور - السيقان - الأوراق

النباتات الوعائية واللاوعائية

البذور (مغطاة البذور - عاريات البذور)

الطحالب

النباتات الطبية


الحيوان

مواضيع عامة في علم الحيوان

علم التشريح

التنوع الإحيائي

البايلوجيا الخلوية


الأحياء المجهرية

البكتيريا

الفطريات

الطفيليات

الفايروسات


علم الأمراض

الاورام

الامراض الوراثية

الامراض المناعية

الامراض المدارية

اضطرابات الدورة الدموية

مواضيع عامة في علم الامراض

الحشرات


التقانة الإحيائية

مواضيع عامة في التقانة الإحيائية


التقنية الحيوية المكروبية

التقنية الحيوية والميكروبات

الفعاليات الحيوية

وراثة الاحياء المجهرية

تصنيف الاحياء المجهرية

الاحياء المجهرية في الطبيعة

أيض الاجهاد

التقنية الحيوية والبيئة

التقنية الحيوية والطب

التقنية الحيوية والزراعة

التقنية الحيوية والصناعة

التقنية الحيوية والطاقة

البحار والطحالب الصغيرة

عزل البروتين

هندسة الجينات


التقنية الحياتية النانوية

مفاهيم التقنية الحيوية النانوية

التراكيب النانوية والمجاهر المستخدمة في رؤيتها

تصنيع وتخليق المواد النانوية

تطبيقات التقنية النانوية والحيوية النانوية

الرقائق والمتحسسات الحيوية

المصفوفات المجهرية وحاسوب الدنا

اللقاحات

البيئة والتلوث


علم الأجنة

اعضاء التكاثر وتشكل الاعراس

الاخصاب

التشطر

العصيبة وتشكل الجسيدات

تشكل اللواحق الجنينية

تكون المعيدة وظهور الطبقات الجنينية

مقدمة لعلم الاجنة


الأحياء الجزيئي

مواضيع عامة في الاحياء الجزيئي


علم وظائف الأعضاء


الغدد

مواضيع عامة في الغدد

الغدد الصم و هرموناتها

الجسم تحت السريري

الغدة النخامية

الغدة الكظرية

الغدة التناسلية

الغدة الدرقية والجار الدرقية

الغدة البنكرياسية

الغدة الصنوبرية

مواضيع عامة في علم وظائف الاعضاء

الخلية الحيوانية

الجهاز العصبي

أعضاء الحس

الجهاز العضلي

السوائل الجسمية

الجهاز الدوري والليمف

الجهاز التنفسي

الجهاز الهضمي

الجهاز البولي


المضادات الميكروبية

مواضيع عامة في المضادات الميكروبية

مضادات البكتيريا

مضادات الفطريات

مضادات الطفيليات

مضادات الفايروسات

علم الخلية

الوراثة

الأحياء العامة

المناعة

التحليلات المرضية

الكيمياء الحيوية

مواضيع متنوعة أخرى

الانزيمات
Principles of chromatography
المؤلف:
Clive Dennison
المصدر:
A guide to protein isolation
الجزء والصفحة:
18-4-2016
2627
Principles of chromatography
The word “chromatography” means “writing with colour” and refers to the early observations on the separation of dyes by paper chromatography. All chromatographic separations depend upon the differential partition of solutes between two phases, a mobile phase and a stationary phase. Such partition between two phases is described by the so-called partition coefficient or distribution coefficient.
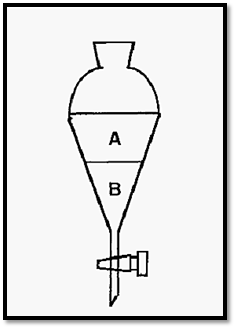
Figure 1. Distribution of a solute between phases in a separating funnel.
Students may recall from Chemistry classes how a dyestuff, for example, will distribute itself between two non-miscible liquid phases in a separating funnel. For any two solvents at a constant temperature, the distribution coefficient (Kd) is a constant and can be defined as:-

The distribution of a solute is not limited to two liquid phases and the distribution coefficient may describe the distribution between any two phases, such as liquid/solid or gas/liquid phases. In chromatography there is always a distribution between two such phases, one kept stationary while the other - the mobile phase - flows over or through it. The stationary phase can therefore be a solid, a liquid, or a solid coated with a liquid. Since it must be fluid, the mobile phase must be either a gas or a liquid. The mechanism of distribution may not always be simple partition, as in a separating funnel. Examples of the different forms of chromatography are shown in Table 1.
Table 1. Forms of chromatography
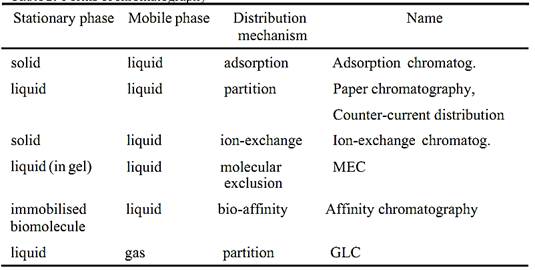
In the case of chromatography, the distribution coefficient is defined
as:-
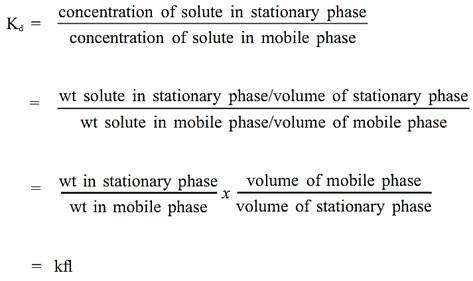
Where k is called the partition ratio (or capacity ratio) and fl is the phase ratio.
In chromatography the stationary phase is typically packed into a tubular column and the mobile phase flows through the packed column. There is continual equilibration of solutes between the mobile and stationary phases, and that length of column where there is effectively one equilibration - such as would occur in a separating funnel - is called a “theoretical plate”. This terminology is derived from fractional distillation of volatile solvents. Since chromatography columns are usually vertically orientated, the length of column in which one equilibration effectively occurs is called the “height equivalent to a theoretical plate”, abbreviated HETP. The HETP is more of a concept than a reality, however, because equilibration is actually continuous, not discrete.
The principle of chromatography may be considered by imagining the column to consist of a stack of theoretical plates and, for clarity, the mobile phase may be considered on one side and the stationary phase on the other (Fig. 2). A column packed with a bead-form stationary phase (A) may be considered as consisting of a vertical stack of theoretical plates (B) in each of which an equilibration between the mobile phase and the stationary phase takes place. Subsequent movement of the mobile phase will displace the mobile “half” of each equilibrated pair downwards, forming new pairs, initially not in equilibrium, but which will equilibrate before, in turn, being displaced.
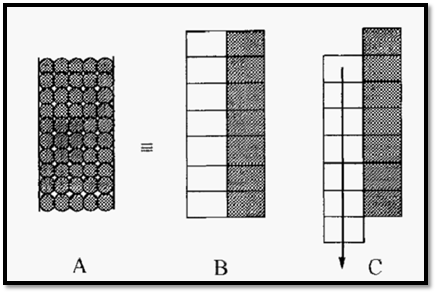
Figure 2. A representation of the mechanism of chromatography.
This representation can be used to illustrate the principle of chromatography, as in the tutorial exercise shown in Fig. 3.
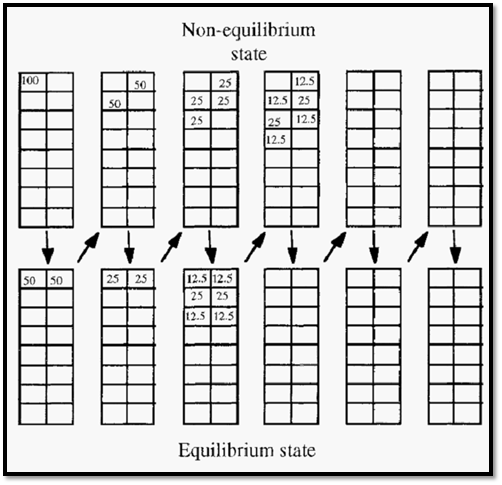
Figure 3. A tutorial illustrating the principle of chromatography.
One hundred units of solute arc injected into the mobile phase of the column (Fig. 3, top left). This then equilibrates with the stationary phase (bottom left) - assume a partition ratio of 1 in this case.
Movement of the mobile phase carries the solute downwards to a new area of the column (top, second from left), where equilibrium again occurs (bottom, second from left). To see if you have grasped the concept. try to fill in the remainder of the numbers, until the right hand columns are filled in. Note the movement of the “peak”, relative to the mobile phase, and note how the peak spreads out.
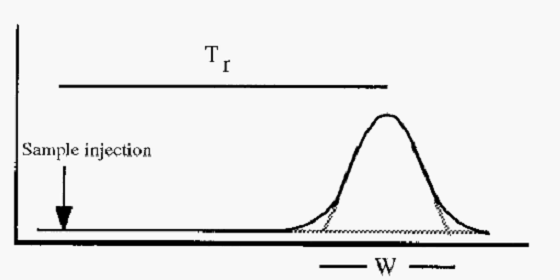
Figure 4. Illustration of retention time (T,) and peak width (W).
The number of theoretical plates (N) in a column is given by the equation:-


Where
Tr = retention time
W = peak width, measured as shown in Fig. 4.
a = a method-dependent constant.
Dividing the length of the packed column bed by the number of theoretical plates gives the HETP. Note that the larger the value of N, the smaller the HETP value and the more efficient the column. For a given retention time, equation .1 indicates that an efficient column (where N is large) will give peaks of smaller width than an inefficient column.
---------------------------------------------------------------------------------------
Resolution of peaks.
The resolution (R), which describes how well any two peaks are separated, is described by the equation:-
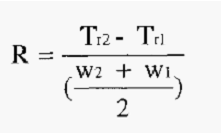
From this it will be seen that the narrower the peak (i.e. the higher
the value of N), the better the resolution will be.
-----------------------------------------------------------------------------------------
The magnitude of the HETP, which should be as small as possible, is influenced by:
• the particle size of the stationary phase, and,
• the flow rate of the mobile phase.
1. The effect of particle size
Reconsider the equilibration of a solute between two phases in a separating funnel. How quickly equilibrium is achieved will depend upon:-
• diffusion across the boundary between A and B, which is proportional
to the surface area of the boundary, and,
• diffusion within A and B to the boundary; the time taken depending upon the distance from the boundary.
For a minimal time to equilibrium, therefore, the boundary surface area should be maximized and the distance of any part of the solutions, A and B, from the boundary should be minimized. This could be achieved by using a separating funnel of unusual design as shown in Fig. 5.

Figure 5. A hypothetical separating funnel for rapid equilibration.
However, the more conventional way of speeding up the attainment of equilibrium is by shaking the separating funnel, so that the solutions are well mixed. The two phases remain separate but one solution will be dispersed in the other, usually in the form of small spheres.
The volume of a single sphere is given by:-


If the total volume of the dispersed phase is “V”, then V will be dispersed into “N” spheres, where:-


i.e. the number of spheres is inversely proportional to r3.
The surface area of a single sphere is given by:-


Therefore, surface area of N spheres
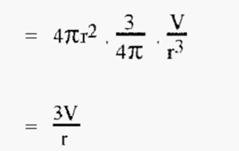

i.e. as the radius of the spheres “r” gets smaller, the total surface area gets larger.
Since the surface area constitutes the interface between the phases, a small value of “r” will ensure a maximal interface area and rapid equilibration. Also, in a sphere, the greatest distance that a solute molecule can be from the surface is “r”, the radius of the sphere.
Therefore, to minimize the diffusion distance and the time to equilibrium, “r” should be minimal. The largest possible distance to the surface for a molecule outside of the packing material also decreases as r decreases.
Shaking a separating funnel vigorously is an effective way of making small spheres and hence of rapidly equilibrating the phases. Similarly, for rapid equilibration, the best size for the spherical particles of a chromatography resin is “as small as possible”. For even packing and good flow characteristics, the resin particles should also be of uniform size.
As “r” decreases, however, the total surface area increases and so the resistance to the flow of the mobile phase also increases. Very small particles, therefore, dictate the use of high pressure pumps - hence HPLC (high pressure liquid chromatography).
2. The effect of the mobile phase flow rate
The effect of the flow rate of the mobile phase is expressed by the so-called Van Deemter equation:-


Where,
HETP = height equivalent to a theoretical plate
F = mobile phase flow rate
A = eddy diffusion (independent of F)
B= molecular diffusion (increases as F decreases)
C = resistance to mass transfer (i.e. smearing) (increases as F increases)
An “eddy” is a swirl in a liquid. “Eddy” diffusion refers to the fact that the mobile phase has to follow a tortuous path around the resin particles, inevitably resulting in some mixing and consequent dilution of a solute peak.
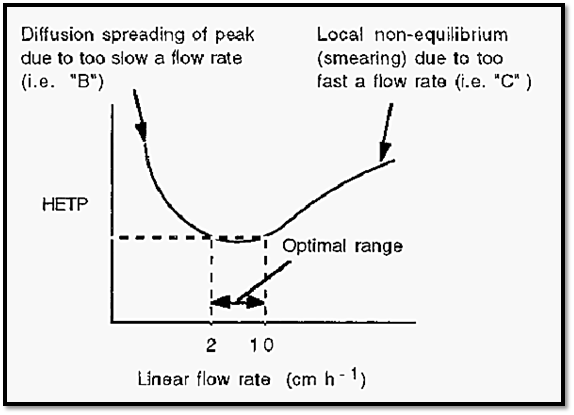
Figure 6. A schematic plot of the van Deemter equation.
If there was no flow in the column, the solute peak would spread with time due to diffusion of the solute molecules, from an area where they are in high concentration to an area where their concentration is less. Similarly, when the flow rate is too slow, the peak will have ample time to spread due to diffusion. On the other hand, if the flow is too fast, solute molecules in the mobile phase will pass the stationary phase without properly equilibrating with it, resulting in peak broadening due to “smearing”. The optimal linear flow rate for typical low-pressure, molecular exclusion chromatography lies in the range of 2-10 cm h-1.
2.1 The relationship between linear and volumetric flow rates.
The easiest way of measuring the mobile phase flow rate is to collect the effluent stream in a measuring cylinder and measure the amount collected in a given time interval. The result will be the volumetric flow rate, which can be expressed in ml h-1. For the chromatographic process, however, the important point is not the volumetric flow rate per se but how fast the mobile phase flows past the stationary phase.
A moment is reflection will reveal that a given volumetric flow rate will give very different chromatographic conditions in a thin column compared to a fat column as the mobile phase will flow past the stationary phase faster in the thin column than in the fat column. To make the chromatographic conditions the same in columns of any diameter, the flow rate can be expressed as the linear flow rate, with units of cm h-1.
The relationship between the volumetric and linear flow rates is given by the equation:-

As an example of the utility of the concept of linear flow rate, imagine that you have developed a successful chromatographic separation, using a column of 2.5 cm i.d. and a volumetric flow rate of 50ml h-1. You then move to another lab to apply your separation method, as a temporary visitor, but you find that the new lab only has columns of 2.0 cm i.d. What can you do about this?
First calculate the length ℓ that 50 ml would occupy in the 2.5 cm column:-

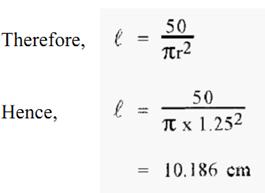
The linear flow rate in the 2.5 cm i.d. column is thus 10.186 cm h-1. From this, calculate the Volumetric flow (“x”) in the 2.0 cm i.d. column that would give the same linear flow rate, i.e.;-
And for
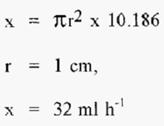
Thus the required volumetric flow rate in the 2.0 cm column is 32 cm h-1. The 2.0 cm i.d. column could be operated at the same length as the 2.5 cm i.d. column, but at the reduced volumetric flow rate of 32 cm h-1.
References
-Dennison, C. (2002). A guide to protein isolation . School of Molecular mid Cellular Biosciences, University of Natal . Kluwer Academic Publishers new york, Boston, Dordrecht, London, Moscow .
 الاكثر قراءة في عزل البروتين
 اخر الاخبار
اخبار العتبة العباسية المقدسة

الآخبار الصحية


 قسم الشؤون الفكرية يصدر كتاباً يوثق تاريخ السدانة في العتبة العباسية المقدسة
 "المهمة".. إصدار قصصي يوثّق القصص الفائزة في مسابقة فتوى الدفاع المقدسة للقصة القصيرة
 (نوافذ).. إصدار أدبي يوثق القصص الفائزة في مسابقة الإمام العسكري (عليه السلام)


