تاريخ الفيزياء

علماء الفيزياء


الفيزياء الكلاسيكية

الميكانيك

الديناميكا الحرارية


الكهربائية والمغناطيسية

الكهربائية

المغناطيسية

الكهرومغناطيسية


علم البصريات

تاريخ علم البصريات

الضوء

مواضيع عامة في علم البصريات

الصوت


الفيزياء الحديثة


النظرية النسبية

النظرية النسبية الخاصة

النظرية النسبية العامة

مواضيع عامة في النظرية النسبية

ميكانيكا الكم

الفيزياء الذرية

الفيزياء الجزيئية


الفيزياء النووية

مواضيع عامة في الفيزياء النووية

النشاط الاشعاعي


فيزياء الحالة الصلبة

الموصلات

أشباه الموصلات

العوازل

مواضيع عامة في الفيزياء الصلبة

فيزياء الجوامد


الليزر

أنواع الليزر

بعض تطبيقات الليزر

مواضيع عامة في الليزر


علم الفلك

تاريخ وعلماء علم الفلك

الثقوب السوداء


المجموعة الشمسية

الشمس

كوكب عطارد

كوكب الزهرة

كوكب الأرض

كوكب المريخ

كوكب المشتري

كوكب زحل

كوكب أورانوس

كوكب نبتون

كوكب بلوتو

القمر

كواكب ومواضيع اخرى

مواضيع عامة في علم الفلك

النجوم

البلازما

الألكترونيات

خواص المادة


الطاقة البديلة

الطاقة الشمسية

مواضيع عامة في الطاقة البديلة

المد والجزر

فيزياء الجسيمات


الفيزياء والعلوم الأخرى

الفيزياء الكيميائية

الفيزياء الرياضية

الفيزياء الحيوية

الفيزياء العامة


مواضيع عامة في الفيزياء

تجارب فيزيائية

مصطلحات وتعاريف فيزيائية

وحدات القياس الفيزيائية

طرائف الفيزياء

مواضيع اخرى
The detection of gravitational lensing
المؤلف:
Heino Falcke and Friedrich W Hehl
المصدر:
THE GALACTIC BLACK HOLE Lectures on General Relativity and Astrophysics
الجزء والصفحة:
p 267
6-2-2017
1882
The detection of gravitational lensing
The mode of detection of lensing events depends on the telescope's angular resolution and its photometric sensitivity. When the two images can be resolved, as in the case discussed, the phenomenon is called a ‘macro lensing’ event. When the two images cannot be resolved, only the variability in the flux of the lensed source is observed. This is called a ‘microlensing’ event. Since θE increases with source distance behind the lens, there is a maximal source distance for microlensing, Dμ, which can be estimated by noting that the angular distance between the two images close to peak magnification is ∼2θE, and so
 (1.1)
(1.1)
where φ is the telescope's angular resolution, θ∞ ≡ ∼ 1.75'' is the Einstein angle for a source at infinity, and it is assumed that φ < θE is the criterion for resolving the two images.
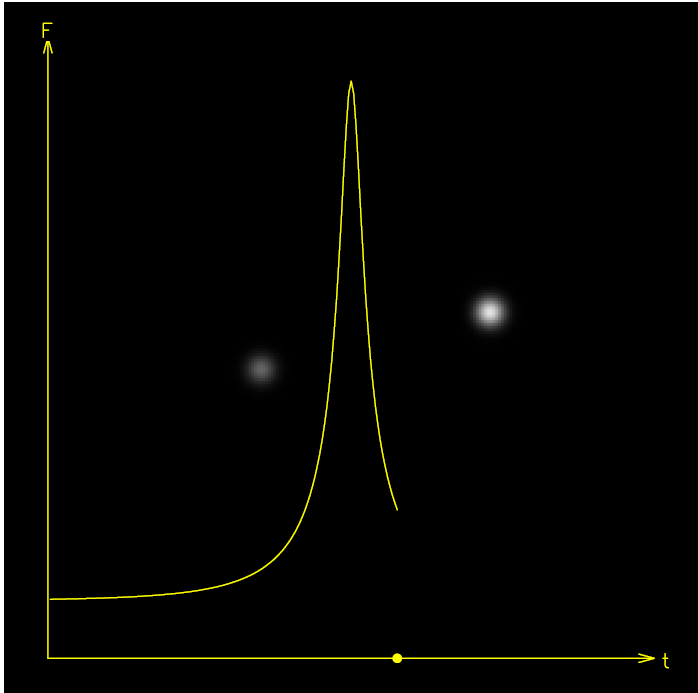
The light curve for a constant velocity trajectory of a background source in the plane of the sky is given by substituting y(t),
 (9.25)
where y0 is the impact parameter of the source trajectory relative to the lens, μ is the apparent motion, in units of θE per time, and t0 is the time when y = y0 (figure 1.1). The resulting light curve is symmetric about t0, and achromatic (i.e. has the same shape in every wavelength). If the photometric sensitivity is large enough to detect the unlensed source, the event will appear as a flaring up of a persistent source; otherwise, it will appear as a transient flare.
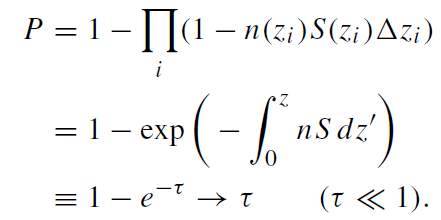
In order to plan the observational strategy for detecting gravitational lensing, or to estimate how likely it is that an observed flare is due to lensing, it is necessary to calculate the detection probability. Two quantities are commonly used to express this probability, the optical depth and the lensing rate. The optical depth for gravitational lensing, τ , is usually defined in relation to the probability of having at least one lens along the line of sight. If the cross section of the lens at position zi is S(zi), and the number density of lenses there is n(zi), then the probability P of having at least one lens along the line of sight is the complement of the probability of not encountering any lens,
 (1.3)
(1.3)
It should be emphasized that τ is not a probability, and that P and τ are interchangeable only when both are small. It is customary to define the lensing cross section as S = πθ2E, which corresponds to the region where a source will be magnified by A > 1.34. This definition is useful when there are many possible lines of sight and it describes the probability that at any given instant a given line of sight will be lensed. This is relevant for Galactic microlensing searches, where millions of background stars are monitored

Figure 1.1. The microlensing light curve that corresponds to the lensing to time t = 19, in the case where the two images can not be resolved. The light curve is overlaid on the two lensed images as they would be observed if they could be resolved. The point on the time axis indicates the position of the source along its trajectory. The flux level on the left is the unmagnified flux of the source. The complete light curve will be symmetric relative to the peak flux.
simultaneously to find the rare one that is lensed by an intervening star. The observational situation for gravitational lensing by the MBH in the Galactic Center is different because the position of the lens is known and fixed, and so there is only one line of sight. In analogy to equation (1.3), the optical depth is then defined in relation to the probability of having at least one source behind the lens along the line of sight,
 (1.4)
(1.4)
where RE is the physical size of θE at the source plane,
 (1.5)
(1.5)
Rough estimates predict τ ∼ 1 for lensing by the MBH (assuming no limits on the photometric sensitivity).
The optical depth does not take into account the relative motions of the lens and source, which reshuffle their random alignment and introduces a timescale to the problem. A more useful quantity for the lensing by the MBH is the lensing event rate with flux above a detection threshold F0 due to the motion of sources behind the MBH,
 (1.6)
(1.6)
where v* is the source star's projected velocity, L* is its luminosity and A >> 1 is assumed. For practical applications, equation (1.6) has to be modified to take into account the range of stellar luminosities and velocities, dust extinction, the total duration of the observations T and the sampling rate ΔT (the mean duration of events magnified by more than A is t = π RE/2Av; only events with ΔT < t < T can be detected).
The dependence of the lensing cross section, timescale and magnification on DLS. The observational limitations, F0, T and ΔT , place restrictions on DLS and the impact parameter for which sources can be detected, and affect the typical timescales and peak magnification that are likely to be observed. For example, high magnification events typically have longer timescales because the source trajectory must have a smaller impact parameter and so it spends more time in the Einstein radius. Therefore, observations with limited temporal sampling will tend to pick out high magnification events. Were any microlensing events detected? A couple of possible transient flaring events were detected very close to Sgr A* (Genzel et al 1997, Ghez et al 1998). For one of these a light curve was recorded, but as it was under-sampled only estimates of a timescale (∼1 yr) and a typical magnification (∼A > 5) could be derived from it. The a posteriori probability of detecting a lensing event was estimated at only 0.5%, but on the other hand, the observed timescale and magnification are close to the median value that is expected for the observational limitations (Alexander and Sternberg 1999). The interpretation of this event remains inconclusive.
 الاكثر قراءة في مواضيع عامة في علم الفلك
 اخر الاخبار
اخبار العتبة العباسية المقدسة

الآخبار الصحية


 قسم الشؤون الفكرية يصدر كتاباً يوثق تاريخ السدانة في العتبة العباسية المقدسة
 "المهمة".. إصدار قصصي يوثّق القصص الفائزة في مسابقة فتوى الدفاع المقدسة للقصة القصيرة
 (نوافذ).. إصدار أدبي يوثق القصص الفائزة في مسابقة الإمام العسكري (عليه السلام)


