تاريخ الفيزياء
علماء الفيزياء


الفيزياء الكلاسيكية
الميكانيك
الديناميكا الحرارية
الكهربائية والمغناطيسية
الكهربائية
المغناطيسية
الكهرومغناطيسية
علم البصريات
تاريخ علم البصريات
الضوء
مواضيع عامة في علم البصريات
الصوت
الفيزياء الحديثة
النظرية النسبية
النظرية النسبية الخاصة
النظرية النسبية العامة
مواضيع عامة في النظرية النسبية
ميكانيكا الكم
الفيزياء الذرية
الفيزياء الجزيئية
الفيزياء النووية
مواضيع عامة في الفيزياء النووية
النشاط الاشعاعي
فيزياء الحالة الصلبة
الموصلات
أشباه الموصلات
العوازل
مواضيع عامة في الفيزياء الصلبة
فيزياء الجوامد
الليزر
أنواع الليزر
بعض تطبيقات الليزر
مواضيع عامة في الليزر
علم الفلك
تاريخ وعلماء علم الفلك
الثقوب السوداء
المجموعة الشمسية
الشمس
كوكب عطارد
كوكب الزهرة
كوكب الأرض
كوكب المريخ
كوكب المشتري
كوكب زحل
كوكب أورانوس
كوكب نبتون
كوكب بلوتو
القمر
كواكب ومواضيع اخرى
مواضيع عامة في علم الفلك
النجوم
البلازما
الألكترونيات
خواص المادة
الطاقة البديلة
الطاقة الشمسية
مواضيع عامة في الطاقة البديلة
المد والجزر
فيزياء الجسيمات
الفيزياء والعلوم الأخرى
الفيزياء الكيميائية
الفيزياء الرياضية
الفيزياء الحيوية
الفيزياء والفلسفة
الفيزياء العامة
مواضيع عامة في الفيزياء
تجارب فيزيائية
مصطلحات وتعاريف فيزيائية
وحدات القياس الفيزيائية
طرائف الفيزياء
مواضيع اخرى

Plotting Radioactive Decay
 المؤلف:
U.S. Department of Commerce, National Technical Information Service, 1993
المؤلف:
U.S. Department of Commerce, National Technical Information Service, 1993
 المصدر:
The Nuclear Physics and Reactor Theory Handbook
المصدر:
The Nuclear Physics and Reactor Theory Handbook
 الجزء والصفحة:
p 35
الجزء والصفحة:
p 35
 29-3-2017
 1919
1919


+
-
20
Plotting Radioactive Decay
It is useful to plot the activity of a nuclide as it changes over time. Plots of this type can be used to determine when the activity will fall below a certain level. This plot is usually done showing activity on either a linear or a logarithmic scale. The decay of the activity of a single nuclide on a logarithmic scale will plot as a straight line because the decay is exponential.
Plotting the data points calculated above on both linear and semilog scales results in the graphs shown in Figure 1.
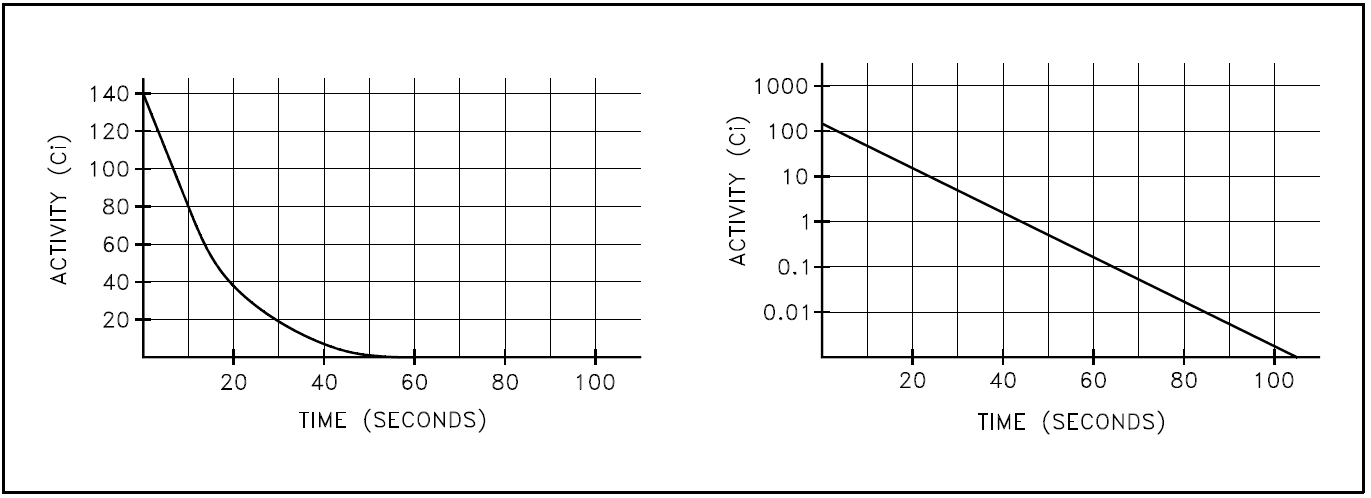
Figure 1: Linear and Semi-log Plots of Nitrogen-16 Decay
If a substance contains more than one radioactive nuclide, the total activity is the sum of the individual activities of each nuclide. As an example, consider a sample of material that contained 1 x 10⁶ atoms of iron-59 that has a half-life of 44.51 days (λ = 1.80 x 10⁻⁷ sec-1 ), 1 x 10⁶ atoms of manganese-54 that has a half-life of 312.2 days (λ = 2.57 x 10⁻⁸ sec-1), and 1 x 10⁶ atoms of cobalt-60 that has a half-life of 1925 days (λ = 4.17 x 10⁻⁹ sec-1). The initial activity of each of the nuclides would be the product of the number of atoms and the decay constant.

Plotting the manner in which the activities of each of the three nuclides decay over time demonstrates that initially the activity of the shortest-lived nuclide (iron-59) dominates the total activity, then manganese-54 dominates. After almost all of the iron and manganese have decayed away, the only contributor to activity will be the cobalt-60. A plot of this combined decay is shown in Figure 2.
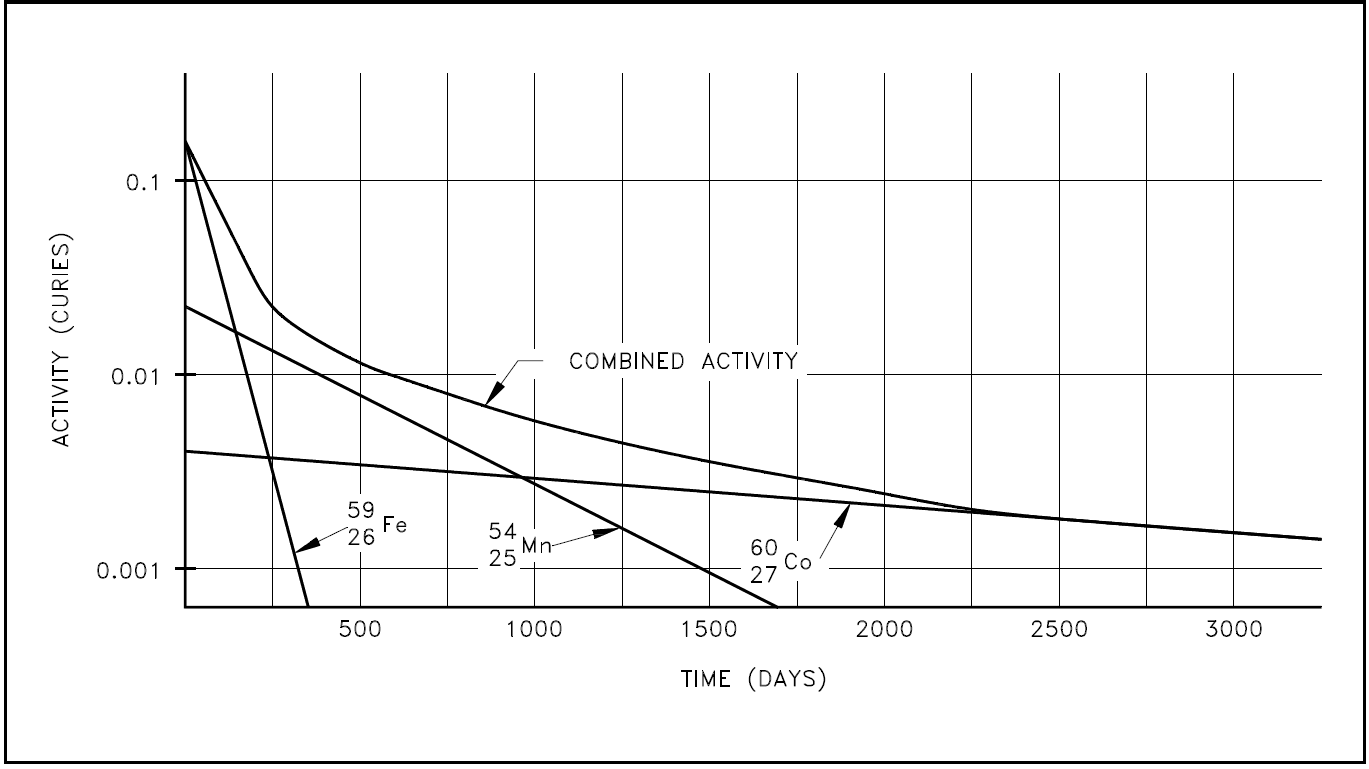
Figure 2: Combined Decay of Iron-56, Manganese-54, and Cobalt-60
 الاكثر قراءة في النشاط الاشعاعي
 اخر الاخبار
اخبار العتبة العباسية المقدسة

الآخبار الصحية


مواضيع ذات صلة
 قسم الشؤون الفكرية يصدر كتاباً يوثق تاريخ السدانة في العتبة العباسية المقدسة
 "المهمة".. إصدار قصصي يوثّق القصص الفائزة في مسابقة فتوى الدفاع المقدسة للقصة القصيرة
 (نوافذ).. إصدار أدبي يوثق القصص الفائزة في مسابقة الإمام العسكري (عليه السلام)