Amino Acids Have Characteristic Titration Curves
 المؤلف:
David L. Nelson, Michael M. Cox
 المصدر:
Book or Source : Lehninger Principles of Biochemistry 6th ed 2012
 الجزء والصفحة:
p 82
 6-4-2017
 7628
7628
Amino Acids Have Characteristic Titration Curves
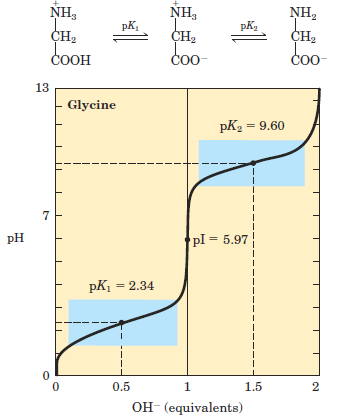
Acid-base titration involves the gradual addition or removal of protons. Figure 1.1 shows the titration curve of the diprotic form of glycine. The plot has two distinct stages, corresponding to deprotonation of two different groups on glycine. Each of the two stages resembles in shape the titration curve of a monoprotic acid, such as acetic acid and can be analyzed in the same way. At very low pH, the predominant ionic species of glycine is the fully protonated form, +H3N–CH2–COOH. At the midpoint in the first stage of the titration, in which the –COOH group of glycine loses its proton, equimolar concentrations of the proton-donor (+H3N–CH2–COOH) and proton-acceptor (+H3N–CH2–COOˉ) species are present. At the midpoint of any titration, a point of inflection is reached where the pH is equal to the pKa of the protonated group being titrated (see Fig. 2–18). For glycine, the pH at the midpoint is 2.34, thus its –COOH group has a pKa (labeled pK1 in Fig. 1.1) of 2.34.
(Recall from Chapter 2 that pH and pKa are simply convenient notations for proton concentration and the equilibrium constant for ionization, respectively. The pKa is a measure of the tendency of a group to give up a proton, with that tendency decreasing tenfold as the pKa increases by one unit.) As the titration proceeds, another important point is reached at pH 5.97. Here there is another point of inflection, at which removal of the first proton is essentially complete and removal of the second has just begun. At this pH glycine is present largely as the dipolar ion +H3N–CH2–COOˉ. We shall return to the significance of this inflection point in the titration curve (labeled pI in Fig. 1.1) shortly. The second stage of the titration corresponds to the removal of a proton from the –NH3 _ group of glycine. The pH at the midpoint of this stage is 9.60, equal to the pKa (labeled pK2 in Fig. 1.1) for the –NH3 _ group. The titration is essentially complete at a pH of about 12, at which point the predominant form of glycine is H2N–CH2–COOˉ.

FIGURE 1.1 Titration of an amino acid. Shown here is the titration curve of 0.1 M glycine at 25 oC. The ionic species predominating at key points in the titration are shown above the graph. The shaded boxes, centered at about pK1 = 2.34 and pK2 = 9.60, indicate the regions of greatest buffering power.
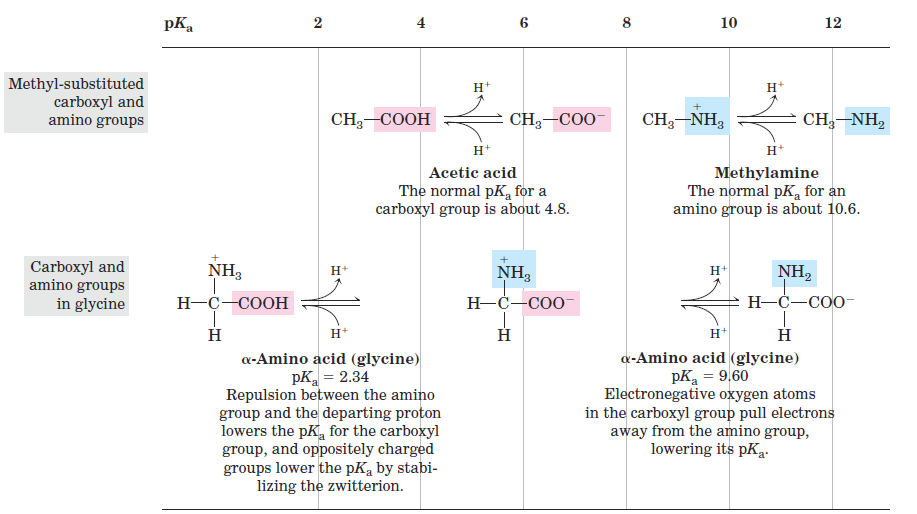
From the titration curve of glycine we can derive several important pieces of information. First, it gives a quantitative measure of the pKa of each of the two ionizing groups: 2.34 for the —COOH group and 9.60 for the —NH3 group. Note that the carboxyl group of glycine is over 100 times more acidic (more easily ionized) than the carboxyl group of acetic acid, which has a pKa of 4.76—about average for a carboxyl group attached to an otherwise unsubstituted aliphatic hydrocarbon. The perturbed pKa of glycine is caused by repulsion between the departing proton and the nearby positively charged amino group on the α-carbon atom, as described in Figure 1.2. The opposite charges on the resulting zwitterion are stabilizing, nudging the equilibrium farther to the right. Similarly, the pKa of the amino group in glycine is perturbed downward relative to the average pKa of an amino group. This effect is due partly to the electronegative oxygen atoms in the carboxyl groups, which tend to pull electrons toward them, increasing the tendency of the amino group to give up a proton. Hence, the α-amino group has a pKa that is lower than that of an aliphatic amine such as methylamine (Fig. 1.2). In short, the pKa of any functional group is greatly affected by its chemical environment, a phenomenon sometimes exploited in the active sites of enzymes to promote exquisitely adapted reaction mechanisms that depend on the perturbed pKa values of proton donor/acceptor groups of specific residues.

FIGURE 1.2 Effect of the chemical environment on pKa. The pKa values for the ionizable groups in glycine are lower than those for simple, methyl-substituted amino and carboxyl groups. These downward perturbations of pKa are due to intramolecular interactions. Similar effects can be caused by chemical groups that happen to be positioned nearby—for example, in the active site of an enzyme.
The second piece of information provided by the titration curve of glycine is that this amino acid has two regions of buffering power. One of these is the relatively flat portion of the curve, extending for approximately 1 pH unit on either side of the first pKa of 2.34, indicating that glycine is a good buffer near this pH. The other buffering zone is centered around pH 9.60. (Note that glycine is not a good buffer at the pH of intracellular fluid or blood, about 7.4.) Within the buffering ranges of glycine, the Henderson-Hasselbalch equation can be used to calculate the proportions of proton-donor and proton-acceptor species of glycine required to make a buffer at a given pH.
 الاكثر قراءة في مواضيع عامة في الكيمياء الحياتية
 اخر الاخبار
اخبار العتبة العباسية المقدسة


