آخر المواضيع المضافة

 علم الكيمياء
الكيمياء التحليلية
الكيمياء الحياتية
الكيمياء العضوية
الكيمياء الفيزيائية
الكيمياء اللاعضوية
مواضيع اخرى في الكيمياء
الكيمياء الصناعية
علم الكيمياء
الكيمياء التحليلية
الكيمياء الحياتية
الكيمياء العضوية
الكيمياء الفيزيائية
الكيمياء اللاعضوية
مواضيع اخرى في الكيمياء
الكيمياء الصناعية | Melting and boiling points of Period 3 Elements |


|
|
Read More
Date: 11-3-2017
Date: 12-3-2017
Date: 28-5-2017
|
The chart shows how the melting and boiling points of the elements change as you go across the period. The figures are plotted in kelvin rather than °C to avoid showing negative temperatures.


|
|
|
|
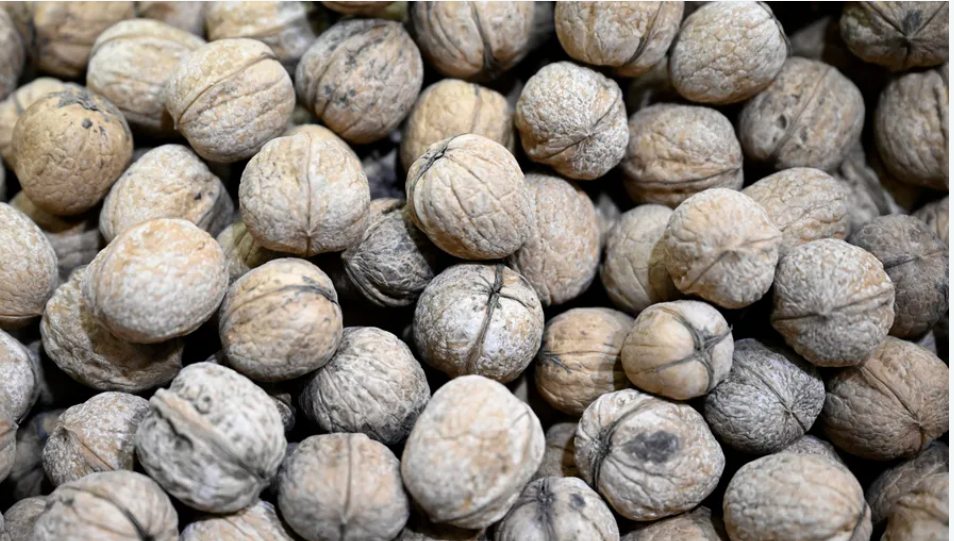
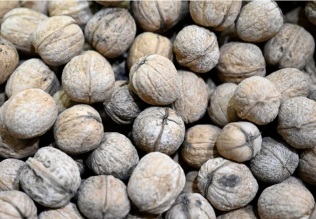
دراسة: حفنة من الجوز يوميا تحميك من سرطان القولون
|
|
|
|
|
|
|
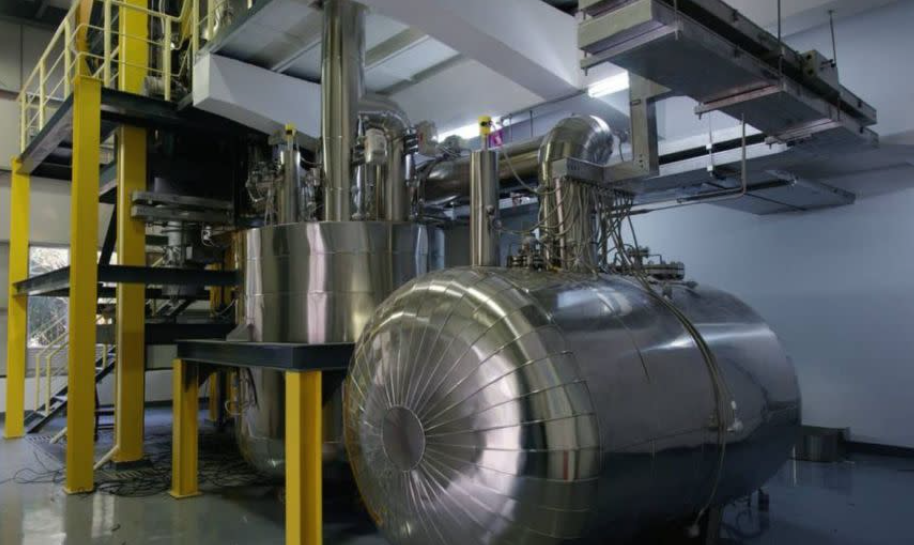
تنشيط أول مفاعل ملح منصهر يستعمل الثوريوم في العالم.. سباق "الأرنب والسلحفاة"
|
|
|
|
|
|
|
الطلبة المشاركون: مسابقة فنِّ الخطابة تمثل فرصة للتنافس الإبداعي وتنمية المهارات
|
|
|