Expressed Gene Number Can Be Measured En Masse
KEY CONCEPTS
-DNA microarray technology allows a snapshot to be taken of the expression of the entire genome in a yeast cell.
-About 75% (approximately 4,500 genes) of the yeast genome is expressed under normal growth conditions.
-DNA microarray technology allows for detailed comparisons of related animal cells to determine (for example) the differences in expression between a normal cell and a cancer cell.
Recent technology allows more systematic and accurate estimates of the number of expressed protein-coding genes. One approach (serial analysis of gene expression, or SAGE) allows a unique sequence tag to be used to identify each mRNA. The technology then allows the abundance of each tag to be measured. This approach identifies 4,665 expressed genes in S. cerevisiae growing under normal conditions, with abundances varying from 0.3 to fewer than 200 transcripts/cell. This means that about 75% of the total gene number (about 6,000) is expressed under these conditions. FIGURE 1. summarizes the number of different mRNAs that is found at each different abundance level.
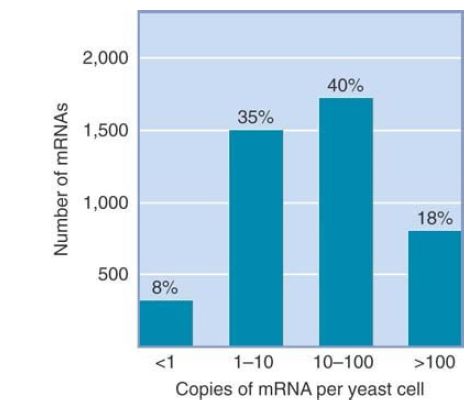
FIGURE 1. The abundances of yeast mRNAs vary from less than 1 per cell (meaning that not every cell has a copy of the mRNA) to more than 100 per cell (encoding the more abundant proteins).
Image courtesy of Rachel E. Ellsworth, Clinical Breast Care Project, Windber Research Institute.
One powerful technology uses chips that contain microarrays, which are arrays of many tiny DNA oligonucleotide samples. Their construction is made possible by knowledge of the sequence of the entire genome. In the case of S. cerevisiae, each of 6,181 ORFs is represented on the micro-array by twenty 25-mer oligonucleotides that perfectly match the sequence of the mRNA and 20 mismatched oligonucleotides that differ at one base position. The expression level of any gene is calculated by subtracting the average signal of a mismatch from its perfect match partner. The entire yeast genome can be represented on four chips. This technology is sensitive enough to detect transcripts of 5,460 genes (about 90% of the genome) and shows that many genes are expressed at low levels, with abundances of 0.1 to 0.2 transcript/cell. (An abundance of less than 1 transcript/cell means that not all cells have a copy of the transcript at any given moment.)
The technology allows not only measurement of levels of gene expression but also detection of differences in expression in mutant cells compared to wild-type cells growing under different conditions, and so on. The results of comparing two states are expressed in the form of a grid, in which each square represents a particular gene and the relative change in expression is indicated by color. These data can be converted to a heat map showing wildtype versus mutant expression of genes under different conditions.
FIGURE 2. shows the difference in expression of a number of genes between normal human breast tissue and cancerous breast tumors. The heat map compares women who breastfed with those who did not, and overall shows that for many genes women who breastfed had increased gene expression.
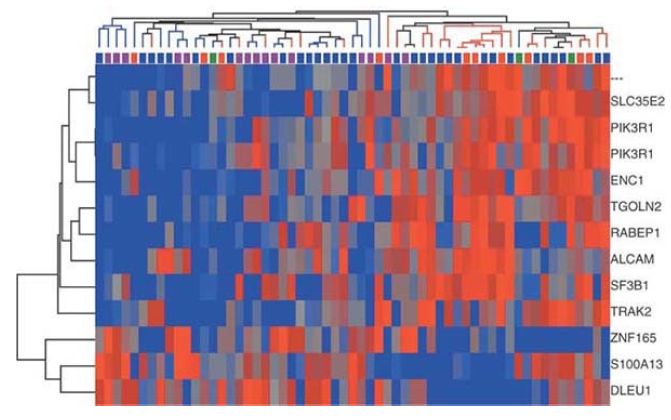
FIGURE 2. “Heat map” of 59 invasive breast tumors from women who breastfed for at least 6 months (red lines above map) or who never breastfed (blue lines). Different tumor subtypes are denoted by the blue, green, red, and purple bars above the map. In the map, the expression of a number of genes (listed at the right) in the tumor is compared to their expression in normal breast tissue: red = higher expression, blue = lower expression, gray = equal expression.
Image courtesy of Rachel E. Ellsworth, Clinical Breast Care Project, Windber Research Institute.
The extension of this and newer technologies (e.g., deep RNA sequencing; see the chapter titled The Content of the Genome) to animal cells will allow the general descriptions based on RNA hybridization analysis to be replaced by exact descriptions of the genes that are expressed, and the abundances of their products, in any particular cell type. A gene expression map of D. melanogaster detects transcriptional activity in some stage of the life cycle in almost all (93%) of predicted genes and shows that 40% have alternatively spliced forms.


