
النبات

مواضيع عامة في علم النبات

الجذور - السيقان - الأوراق

النباتات الوعائية واللاوعائية

البذور (مغطاة البذور - عاريات البذور)

الطحالب

النباتات الطبية


الحيوان

مواضيع عامة في علم الحيوان

علم التشريح

التنوع الإحيائي

البايلوجيا الخلوية


الأحياء المجهرية

البكتيريا

الفطريات

الطفيليات

الفايروسات


علم الأمراض

الاورام

الامراض الوراثية

الامراض المناعية

الامراض المدارية

اضطرابات الدورة الدموية

مواضيع عامة في علم الامراض

الحشرات


التقانة الإحيائية

مواضيع عامة في التقانة الإحيائية


التقنية الحيوية المكروبية

التقنية الحيوية والميكروبات

الفعاليات الحيوية

وراثة الاحياء المجهرية

تصنيف الاحياء المجهرية

الاحياء المجهرية في الطبيعة

أيض الاجهاد

التقنية الحيوية والبيئة

التقنية الحيوية والطب

التقنية الحيوية والزراعة

التقنية الحيوية والصناعة

التقنية الحيوية والطاقة

البحار والطحالب الصغيرة

عزل البروتين

هندسة الجينات


التقنية الحياتية النانوية

مفاهيم التقنية الحيوية النانوية

التراكيب النانوية والمجاهر المستخدمة في رؤيتها

تصنيع وتخليق المواد النانوية

تطبيقات التقنية النانوية والحيوية النانوية

الرقائق والمتحسسات الحيوية

المصفوفات المجهرية وحاسوب الدنا

اللقاحات

البيئة والتلوث


علم الأجنة

اعضاء التكاثر وتشكل الاعراس

الاخصاب

التشطر

العصيبة وتشكل الجسيدات

تشكل اللواحق الجنينية

تكون المعيدة وظهور الطبقات الجنينية

مقدمة لعلم الاجنة


الأحياء الجزيئي

مواضيع عامة في الاحياء الجزيئي


علم وظائف الأعضاء


الغدد

مواضيع عامة في الغدد

الغدد الصم و هرموناتها

الجسم تحت السريري

الغدة النخامية

الغدة الكظرية

الغدة التناسلية

الغدة الدرقية والجار الدرقية

الغدة البنكرياسية

الغدة الصنوبرية

مواضيع عامة في علم وظائف الاعضاء

الخلية الحيوانية

الجهاز العصبي

أعضاء الحس

الجهاز العضلي

السوائل الجسمية

الجهاز الدوري والليمف

الجهاز التنفسي

الجهاز الهضمي

الجهاز البولي


المضادات الميكروبية

مواضيع عامة في المضادات الميكروبية

مضادات البكتيريا

مضادات الفطريات

مضادات الطفيليات

مضادات الفايروسات

علم الخلية

الوراثة

الأحياء العامة

المناعة

التحليلات المرضية

الكيمياء الحيوية

مواضيع متنوعة أخرى

الانزيمات
Chromosomes Have Banding Patterns
المؤلف:
JOCELYN E. KREBS, ELLIOTT S. GOLDSTEIN and STEPHEN T. KILPATRICK
المصدر:
LEWIN’S GENES XII
الجزء والصفحة:
22-3-2021
3678
Chromosomes Have Banding Patterns
KEY CONCEPTS
-Certain staining techniques cause the chromosomes to have the appearance of a series of striations, which are called G-bands.
-The G-bands are lower in G-C content than the interbands.
-Genes are concentrated in the G-C–rich interbands.
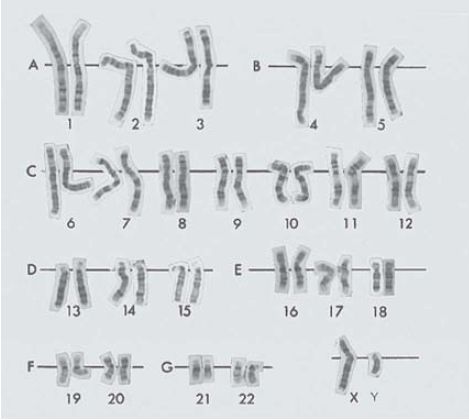
As a result of the diffuse state of chromatin, it is difficult to directly determine the specificity of its organization. Three-dimensional sequence-level mapping techniques are beginning to give us insights into the organization of interphase chromatin. At the level of the chromosome, each member of the complement has a different and reproducible ultrastructure. When mitotic chromosomes are subjected to proteolytic enzyme (trypsin) treatment followed by staining with the chemical dye Giemsa, they generate distinct chromosome-specific patterns called G-bands. FIGURE 1 presents an example of the human set.

FIGURE 1. G-banding generates a characteristic lateral series of bands in each member of the chromosome set.
Photo courtesy of Lisa Shaffer, Washington State University, Spokane.
Until the development of this technique, researchers could distinguish human chromosomes only by their overall size and the relative location of the centromere. G-banding allows each chromosome to be identified by its characteristic banding pattern.
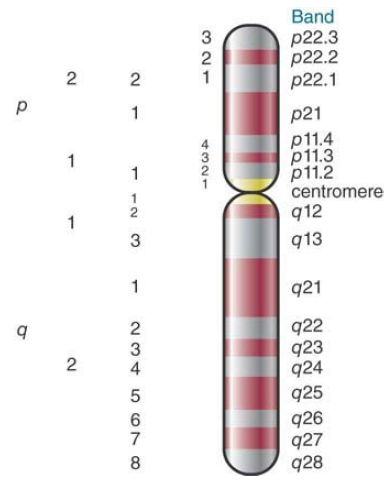
This pattern allows translocations from one chromosome to another to be identified by comparison with the original diploid set. FIGURE 2 shows a diagram of the bands of the human X chromosome.
The bands are large structures, each approximately 107 bp of DNA, and each of which can include many hundreds of genes.

FIGURE 2 The human X chromosome can be divided into distinct regions by its banding pattern. The short arm is p and the long arm is q; each arm is divided into larger regions that are further subdivided. This map shows a low-resolution structure; at higher resolution, some bands are further subdivided into smaller bands and interbands, e.g., p21 is divided into p21.1, p21.2, and p21.3.
The banding technique is of enormous practical use, but the mechanism of banding remains a mystery. All that is certain is that the dye stains untreated chromosomes more or less uniformly.
Thus, the generation of bands depends on a variety of treatments, such as proteolytic digestion, that change the response of the chromosome (presumably by extracting the component that binds the stain from the nonbanded regions). Researchers can generate similar bands by using an assortment of other treatments.
Researchers often can distinguish G-bands from interbands by their lower G-C content. If there are 10 bands on a large chromosome with a total content of 100 megabases (Mb), this means that the chromosome is divided into regions averaging 5 Mb in length that alternate between low G-C (band) and high G-C (interband) content. There is a tendency for genes to be enriched in the interband regions. All of this argues for some long-range, sequence-dependent organization.
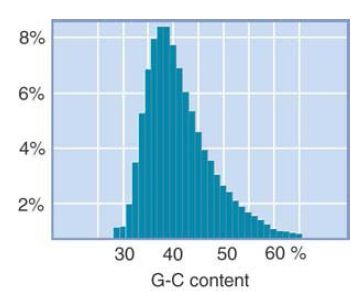
The human genome sequence confirms this basic observation. FIGURE 3 shows that there are distinct fluctuations in G-C content when the genome is divided into small bins (DNA segments or lengths). The average of 41% G-C is common to mammalian genomes. There are regions as low as 30% or as high as 65%.
The average length of regions with greater than 43% G-C is 200 to 250 kb. This makes it clear that the band/interband structure does not correspond directly with the more numerous homogeneous segments that alternate in G-C content, although the bands do tend to contain a higher content of low G-C segments. Genes are concentrated in regions of higher G-C content.

FIGURE 3 There are large fluctuations in G-C content over short distances. Each bar shows the percentage of 20-kb fragments with the given G-C content.
 الاكثر قراءة في مواضيع عامة في الاحياء الجزيئي
 اخر الاخبار
اخبار العتبة العباسية المقدسة

الآخبار الصحية


 قسم الشؤون الفكرية يصدر كتاباً يوثق تاريخ السدانة في العتبة العباسية المقدسة
 "المهمة".. إصدار قصصي يوثّق القصص الفائزة في مسابقة فتوى الدفاع المقدسة للقصة القصيرة
 (نوافذ).. إصدار أدبي يوثق القصص الفائزة في مسابقة الإمام العسكري (عليه السلام)


