
Grammar


Tenses


Present

Present Simple

Present Continuous

Present Perfect

Present Perfect Continuous


Past

Past Simple

Past Continuous

Past Perfect

Past Perfect Continuous


Future

Future Simple

Future Continuous

Future Perfect

Future Perfect Continuous


Parts Of Speech


Nouns

Countable and uncountable nouns

Verbal nouns

Singular and Plural nouns

Proper nouns

Nouns gender

Nouns definition

Concrete nouns

Abstract nouns

Common nouns

Collective nouns

Definition Of Nouns

Animate and Inanimate nouns

Nouns


Verbs

Stative and dynamic verbs

Finite and nonfinite verbs

To be verbs

Transitive and intransitive verbs

Auxiliary verbs

Modal verbs

Regular and irregular verbs

Action verbs

Verbs


Adverbs

Relative adverbs

Interrogative adverbs

Adverbs of time

Adverbs of place

Adverbs of reason

Adverbs of quantity

Adverbs of manner

Adverbs of frequency

Adverbs of affirmation

Adverbs


Adjectives

Quantitative adjective

Proper adjective

Possessive adjective

Numeral adjective

Interrogative adjective

Distributive adjective

Descriptive adjective

Demonstrative adjective


Pronouns

Subject pronoun

Relative pronoun

Reflexive pronoun

Reciprocal pronoun

Possessive pronoun

Personal pronoun

Interrogative pronoun

Indefinite pronoun

Emphatic pronoun

Distributive pronoun

Demonstrative pronoun

Pronouns


Pre Position


Preposition by function

Time preposition

Reason preposition

Possession preposition

Place preposition

Phrases preposition

Origin preposition

Measure preposition

Direction preposition

Contrast preposition

Agent preposition


Preposition by construction

Simple preposition

Phrase preposition

Double preposition

Compound preposition

prepositions


Conjunctions

Subordinating conjunction

Correlative conjunction

Coordinating conjunction

Conjunctive adverbs

conjunctions


Interjections

Express calling interjection

Phrases

Sentences


Grammar Rules

Passive and Active

Preference

Requests and offers

wishes

Be used to

Some and any

Could have done

Describing people

Giving advices

Possession

Comparative and superlative

Giving Reason

Making Suggestions

Apologizing

Forming questions

Since and for

Directions

Obligation

Adverbials

invitation

Articles

Imaginary condition

Zero conditional

First conditional

Second conditional

Third conditional

Reported speech

Demonstratives

Determiners


Linguistics

Phonetics

Phonology

Linguistics fields

Syntax

Morphology

Semantics

pragmatics

History

Writing

Grammar

Phonetics and Phonology

Semiotics


Reading Comprehension

Elementary

Intermediate

Advanced


Teaching Methods

Teaching Strategies

Assessment
Tracing Cause and Effect
المؤلف:
BARBARA MINTO
المصدر:
THE MINTO PYRAMID PRINCIPLE
الجزء والصفحة:
145-9
2024-09-25
802
Tracing Cause and Effect
The second way to diagnose a problem is to trace the cause-effect elements, activities, or tasks that go to make up a particular end result. You can do this by showing levels of financial elements, tasks, or activities.
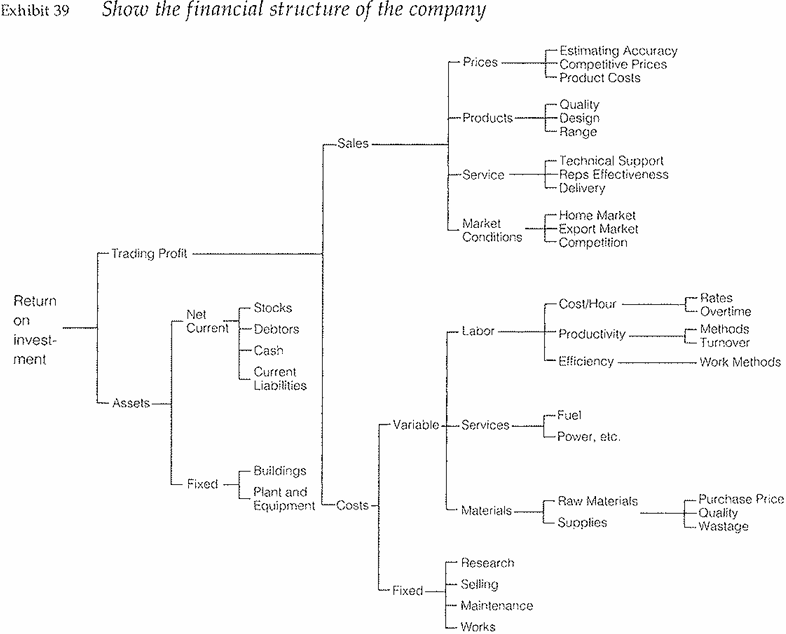
1. Financial Structure. You would use this approach if you wanted to show the financial structure of a company, say to identify the reasons for the R1 low return on investment (Exhibit 39).

Putting numbers on the chart, you would be able to judge very quickly whether the problem stems from the fact that Sales are low compared to last year, or Costs are high, or both. Accordingly, you would break down each element to show its key influences, and then identify the components of each influence (e.g., for Sales, product volume is dictated by the quality of the product, the design, and the range offered). Once the structure is complete, you would seek to determine, "Is the problem in the product volume? Is it in the pricing?" etc, and think through the data you would need to answer each question yes or no.
2. Task Structure. A deeper, more explicit approach is to make the tree show the important tasks of the business that it must organize itself to perform (Exhibit 40). To do so you begin with EPS (earnings per share) and divide the tree in terms of the company's financial structure, stating each element as a discrete managerial task. Then you impose the Profit and Loss Accom and the Balance Sheet on this structure, again stating each item as a task. This approach has the great advantage of identifying the kind of action required should the problem be found at this point.

Contribution in a cigarette company, for example, is composed of Revenue minus Specification Costs (leaf, packing materials, duty, direct labor), minus Advertising and Promotion. These categories then become tasks (Increase Net Sales, Reduce Leaf Costs, etc.). You now know the key tasks of the business, and can analyze the numbers in the tree (trends, sensitivities, comparisons to industry and competition) to determine the priorities for performing them to increase EPS.
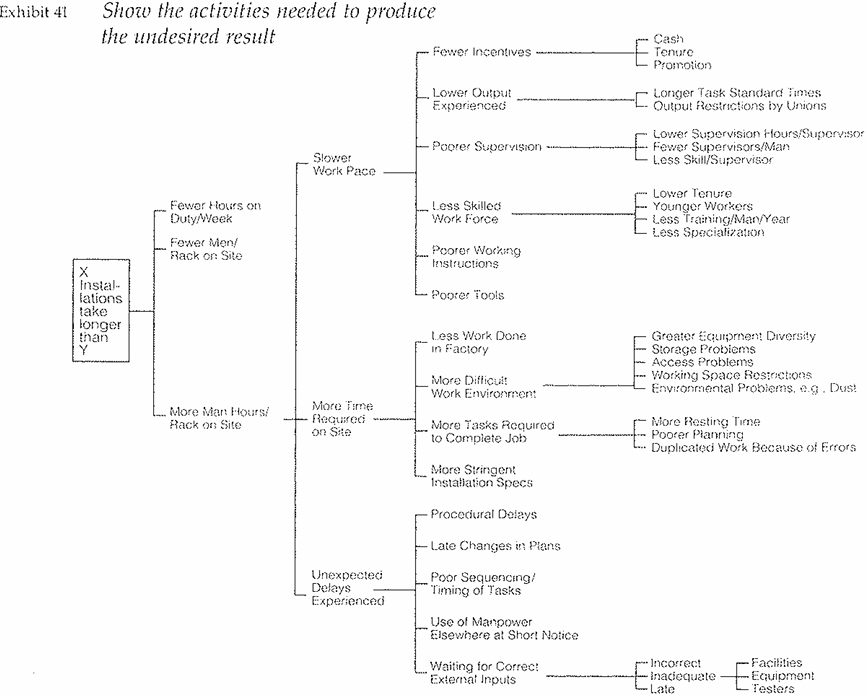
3. Activity Structure. Another approach is to use a tree to trace the activities that have to be performed to produce an undesirable end objective-high costs, for example, or overlong installation times (Exhibit 41). The trick here is to visualize all the causes that could possibly bring about the effect, and relate them at their proper levels.
For example, installation of telephone switching equipment involves work partly done in the contractor's factory and partly done by his men on the site. Elements at the site are the men doing the building, the facilities available to them, the equipment being installed, the testers testing the equipment, and the customer approving the procedure at various intervals. How do these all relate?
As you can see from Exhibit 41, you begin your tree with the undesirable effect you are trying to understand, that installations take longer than expected. At the next level you hypothesize the mutually exclusive and collectively exhaustive reasons that this result could occur: fewer men on each rack, more hours per man on each rack, fewer hours on duty per week.
You then take each possible reason and break it down further. What could cause more hours per man on each rack? Either the men are working more slowly, or the job itself demands more time, or there are unexpected delays. Again, you take each possibility and ask, why would this happen? The result is a complete list of the areas where facts could be gathered and analyzed. Your experience in the industry will tell you where to look first.

 الاكثر قراءة في Writing
 اخر الاخبار
اخبار العتبة العباسية المقدسة

الآخبار الصحية


 قسم الشؤون الفكرية يصدر كتاباً يوثق تاريخ السدانة في العتبة العباسية المقدسة
 "المهمة".. إصدار قصصي يوثّق القصص الفائزة في مسابقة فتوى الدفاع المقدسة للقصة القصيرة
 (نوافذ).. إصدار أدبي يوثق القصص الفائزة في مسابقة الإمام العسكري (عليه السلام)


