
علم الكيمياء

تاريخ الكيمياء والعلماء المشاهير

التحاضير والتجارب الكيميائية

المخاطر والوقاية في الكيمياء

اخرى

مقالات متنوعة في علم الكيمياء

كيمياء عامة


الكيمياء التحليلية

مواضيع عامة في الكيمياء التحليلية

التحليل النوعي والكمي

التحليل الآلي (الطيفي)

طرق الفصل والتنقية


الكيمياء الحياتية

مواضيع عامة في الكيمياء الحياتية

الكاربوهيدرات

الاحماض الامينية والبروتينات

الانزيمات

الدهون

الاحماض النووية

الفيتامينات والمرافقات الانزيمية

الهرمونات


الكيمياء العضوية

مواضيع عامة في الكيمياء العضوية

الهايدروكاربونات

المركبات الوسطية وميكانيكيات التفاعلات العضوية

التشخيص العضوي

تجارب وتفاعلات في الكيمياء العضوية


الكيمياء الفيزيائية

مواضيع عامة في الكيمياء الفيزيائية

الكيمياء الحرارية

حركية التفاعلات الكيميائية

الكيمياء الكهربائية


الكيمياء اللاعضوية

مواضيع عامة في الكيمياء اللاعضوية

الجدول الدوري وخواص العناصر

نظريات التآصر الكيميائي

كيمياء العناصر الانتقالية ومركباتها المعقدة


مواضيع اخرى في الكيمياء

كيمياء النانو

الكيمياء السريرية

الكيمياء الطبية والدوائية

كيمياء الاغذية والنواتج الطبيعية

الكيمياء الجنائية


الكيمياء الصناعية

البترو كيمياويات

الكيمياء الخضراء

كيمياء البيئة

كيمياء البوليمرات

مواضيع عامة في الكيمياء الصناعية

الكيمياء الاشعاعية والنووية
An Integral Role for Chemical Analysis: Feedbac k Control Systems
المؤلف:
D. A. Skoog, F. J.Holler, D M. West, and S. R. Crouch
المصدر:
Fundamentals of Analytical Chemistry
الجزء والصفحة:
9th. p 10
19-3-2016
4224
An Integral Role for Chemical Analysis:
Feedbac k Control Systems
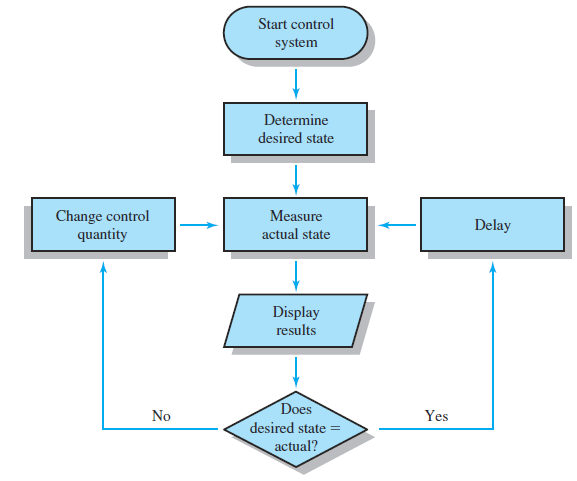
Analytical chemistry is usually not an end in itself but is part of a bigger picture in which the analytical results may be used to help control a patient’s health, to control the amount of mercury in fish, to control the quality of a product, to determine the status of a synthesis, or to find out whether there is life on Mars. Chemical analysis is the measurement element in all of these examples and in many other cases. Consider the role of quantitative analysis in the determination and control of the concentration of glucose in blood. The system flow diagram of Figure 1 illustrates the process. Patients suffering from insulin-dependent diabetes mellitus develop hyperglycemia, which manifests itself in a blood glucose concentration above the normal concentration range of 65 to 100 mg/dL. We begin our example by determining that the desired state is a blood glucose level below 100 mg/dL. Many patients must monitor their blood glucose levels by periodically submitting samples to a clinical laboratory for analysis or by measuring the levels themselves using a handheld electronic glucose monitor. The first step in the monitoring process is to determine the actual state by collecting a blood sample from the patient and measuring the blood glucose level. The results are displayed, and then the actual state is compared to the desired state, as shown in Figure 1. If the measured blood glucose level is above 100 mg/dL, the patient’s insulin level, which is a controllable quantity, is increased by injection or oral administration. After a delay to allow the insulin time to take effect, the glucose level is measured again to determine if the desired state has been achieved. If the level is below the threshold, the insulin level has been maintained, so no insulin is required. After a suitable delay time, the blood glucose level is measured again, and the cycle is repeated. In this way, the insulin level in the patient’s blood, and thus the blood glucose level, is maintained at or below the critical threshold, which keeps the metabolism of the patient under control. The process of continuous measurement and control is often referred to as a feedback system, and the cycle of measurement, comparison, and control is called a feedback loop. These ideas are widely applied in biological and biomedical systems, mechanical systems, and electronics. From the measurement and control of the concentration of manganese in steel to maintaining the proper level of chlorine in a swimming pool, chemical analysis plays a central role in a broad range of systems.

Figure 1 Feedback system flow diagram. The desired system state is defined, the actual state of the system is measured, and the two states are compared. The difference between the two states is used to change a controllable quantity that results in a change in the state of the system. Quantitative measurements are again performed on the system, and the comparison is repeated. The new difference between the desired state and the actual state is again used to change the state of the system if necessary. The process provides continuous monitoring and feedback to maintain the controllable quantity, and thus the actual state, at the proper level. The text describes the monitoring and control of blood glucose as an example of a feedback control system.
 الاكثر قراءة في مواضيع عامة في الكيمياء التحليلية
 اخر الاخبار
اخبار العتبة العباسية المقدسة

الآخبار الصحية


 قسم الشؤون الفكرية يصدر كتاباً يوثق تاريخ السدانة في العتبة العباسية المقدسة
 "المهمة".. إصدار قصصي يوثّق القصص الفائزة في مسابقة فتوى الدفاع المقدسة للقصة القصيرة
 (نوافذ).. إصدار أدبي يوثق القصص الفائزة في مسابقة الإمام العسكري (عليه السلام)


