تاريخ الفيزياء

علماء الفيزياء


الفيزياء الكلاسيكية

الميكانيك

الديناميكا الحرارية


الكهربائية والمغناطيسية

الكهربائية

المغناطيسية

الكهرومغناطيسية


علم البصريات

تاريخ علم البصريات

الضوء

مواضيع عامة في علم البصريات

الصوت


الفيزياء الحديثة


النظرية النسبية

النظرية النسبية الخاصة

النظرية النسبية العامة

مواضيع عامة في النظرية النسبية

ميكانيكا الكم

الفيزياء الذرية

الفيزياء الجزيئية


الفيزياء النووية

مواضيع عامة في الفيزياء النووية

النشاط الاشعاعي


فيزياء الحالة الصلبة

الموصلات

أشباه الموصلات

العوازل

مواضيع عامة في الفيزياء الصلبة

فيزياء الجوامد


الليزر

أنواع الليزر

بعض تطبيقات الليزر

مواضيع عامة في الليزر


علم الفلك

تاريخ وعلماء علم الفلك

الثقوب السوداء


المجموعة الشمسية

الشمس

كوكب عطارد

كوكب الزهرة

كوكب الأرض

كوكب المريخ

كوكب المشتري

كوكب زحل

كوكب أورانوس

كوكب نبتون

كوكب بلوتو

القمر

كواكب ومواضيع اخرى

مواضيع عامة في علم الفلك

النجوم

البلازما

الألكترونيات

خواص المادة


الطاقة البديلة

الطاقة الشمسية

مواضيع عامة في الطاقة البديلة

المد والجزر

فيزياء الجسيمات


الفيزياء والعلوم الأخرى

الفيزياء الكيميائية

الفيزياء الرياضية

الفيزياء الحيوية

الفيزياء العامة


مواضيع عامة في الفيزياء

تجارب فيزيائية

مصطلحات وتعاريف فيزيائية

وحدات القياس الفيزيائية

طرائف الفيزياء

مواضيع اخرى
Diffraction by opaque screens
المؤلف:
Richard Feynman, Robert Leighton and Matthew Sands
المصدر:
The Feynman Lectures on Physics
الجزء والصفحة:
Volume I, Chapter 30
2024-03-20
1591
Now we come to a very interesting situation. Suppose that we have an opaque sheet with holes in it, and a light on one side of it. We want to know what the intensity is on the other side. What most people say is that the light shines through the holes, and produces an effect on the other side. It will turn out that one gets the right answer, to an excellent approximation, if he assumes that there are sources distributed with uniform density across the open holes, and that the phases of these sources are the same as they would have been if the opaque material were absent. Of course, actually there are no sources at the holes, in fact that is the only place that there are certainly no sources. Nevertheless, we get the correct diffraction patterns by considering the holes to be the only places that there are sources; that is a rather peculiar fact. We shall explain later why this is true, but for now let us just suppose that it is.
In the theory of diffraction there is another kind of diffraction that we should briefly discuss. It is usually not discussed in an elementary course as early as this, only because the mathematical formulas involved in adding these little vectors are a little elaborate. Otherwise, it is exactly the same as we have been doing all along. All the interference phenomena are the same; there is nothing very much more advanced involved, only the circumstances are more complicated and it is harder to add the vectors together, that is all.

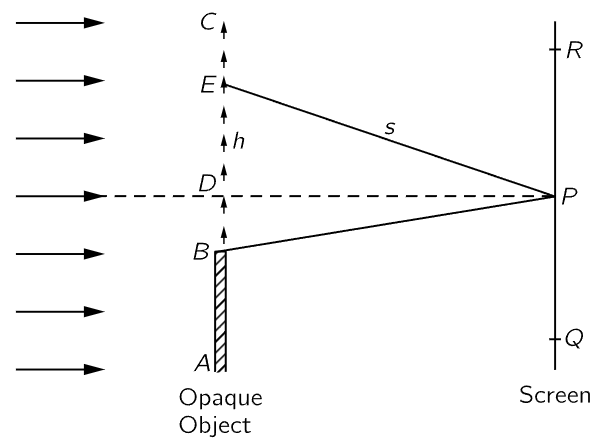
Fig. 30–7. A distant light source casts a shadow of an opaque object on a screen.
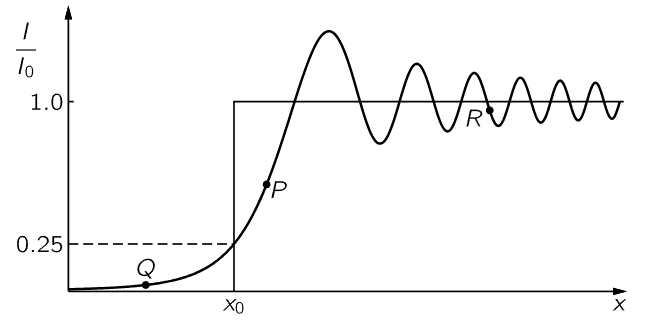
Suppose that we have light coming in from infinity, casting a shadow of an object. Figure 30–7 shows a screen on which the shadow of an object AB is made by a light source very far away compared with one wavelength. Now we would expect that outside the shadow, the intensity is all bright, and inside it, it is all dark. As a matter of fact, if we plot the intensity as a function of position near the shadow edge, the intensity rises and then overshoots, and wobbles, and oscillates about in a very peculiar manner near this edge (Fig. 30–9). We now shall discuss the reason for this. If we use the theorem that we have not yet proved, then we can replace the actual problem by a set of effective sources uniformly distributed over the open space beyond the object.
We imagine a large number of very closely spaced antennas, and we want the intensity at some point P. That looks just like what we have been doing. Not quite; because our screen is not at infinity. We do not want the intensity at infinity, but at a finite point. To calculate the intensity at some particular place, we have to add the contributions from all the antennas. First there is an antenna at D, exactly opposite P; if we go up a little bit in angle, let us say a height h, then there is an increase in delay (there is also a change in amplitude because of the change in distance, but this is a very small effect if we are at all far away, and is much less important than the difference in the phases). Now the path difference EP−DP is approximately h2/2s, so that the phase difference is proportional to the square of how far we go from D, while in our previous work s was infinite, and the phase difference was linearly proportional to h. When the phases are linearly proportional, each vector adds at a constant angle to the next vector. What we now need is a curve which is made by adding a lot of infinitesimal vectors with the requirement that the angle they make shall increase, not linearly, but as the square of the length of the curve. To construct that curve involves slightly advanced mathematics, but we can always construct it by actually drawing the arrows and measuring the angles. In any case, we get the marvelous curve (called Cornu’s spiral) shown in Fig. 30–8. Now how do we use this curve?

Fig. 30–8. The addition of amplitudes for many in-phase oscillators whose phase delays vary as the square of the distance from point D of the previous figure.
If we want the intensity, let us say, at point P, we add a lot of contributions of different phases from point D on up to infinity, and from D down only to point BP. So, we start at BP in Fig. 30–8, and draw a series of arrows of ever-increasing angle. Therefore, the total contribution above point BP all goes along the spiraling curve. If we were to stop integrating at some place, then the total amplitude would be a vector from B to that point; in this particular problem we are going to infinity, so the total answer is the vector BP∞. Now the position on the curve which corresponds to point BP on the object depends upon where point P is located, since point D, the inflection point, always corresponds to the position of point P. Thus, depending upon where P is located above B, the beginning point will fall at various positions on the lower left part of the curve, and the resultant vector BP∞, will have many maxima and minima (Fig. 30–9).

Fig. 30–9. The intensity near the edge of a shadow. The geometrical shadow edge is at x0.
On the other hand, if we are at Q, on the other side of P, then we are using only one end of the spiral curve, and not the other end. In other words, we do not even start at D, but at BQ, so on this side we get an intensity which continuously falls off as Q goes farther into the shadow.
One point that we can immediately calculate with ease, to show that we really understand it, is the intensity exactly opposite the edge. The intensity here is 1/4 that of the incident light. Reason: Exactly at the edge (so the endpoint B of the arrow is at D in Fig. 30–8) we have half the curve that we would have had if we were far into the bright region. If our point R is far into the light, we go from one end of the curve to the other, that is, one full unit vector; but if we are at the edge of the shadow, we have only half the amplitude—1/4 the intensity.
We have been finding the intensity produced in various directions from various distributions of sources. As a final example we shall derive a formula which we shall need for the next chapter on the theory of the index of refraction. Up to this point relative intensities have been sufficient for our purpose, but this time we shall find the complete formula for the field in the following situation.
 الاكثر قراءة في مواضيع عامة في علم البصريات
 اخر الاخبار
اخبار العتبة العباسية المقدسة

الآخبار الصحية


 قسم الشؤون الفكرية يصدر كتاباً يوثق تاريخ السدانة في العتبة العباسية المقدسة
 "المهمة".. إصدار قصصي يوثّق القصص الفائزة في مسابقة فتوى الدفاع المقدسة للقصة القصيرة
 (نوافذ).. إصدار أدبي يوثق القصص الفائزة في مسابقة الإمام العسكري (عليه السلام)


