

 الفيزياء الكلاسيكية
 الكهربائية والمغناطيسية
 علم البصريات
 الفيزياء الحديثة
 النظرية النسبية
 الفيزياء النووية
 فيزياء الحالة الصلبة
 الليزر
 علم الفلك
 المجموعة الشمسية
 الطاقة البديلة
 الفيزياء والعلوم الأخرى
 مواضيع عامة في الفيزياء
|
أقرأ أيضاً
التاريخ: 2024-01-27
التاريخ: 28-2-2017
التاريخ: 2024-01-04
التاريخ: 9-12-2020
|
The next kind of waves to be discussed are the more complicated waves in solids. We have already discussed sound waves in gas and in liquid, and there is a direct analog to a sound wave in a solid. If a sudden push is applied to a solid, it is compressed. It resists the compression, and a wave analogous to sound is started. However, there is another kind of wave that is possible in a solid, and which is not possible in a fluid. If a solid is distorted by pushing it sideways (called shearing), then it tries to pull itself back. That is by definition what distinguishes a solid from a liquid: if we distort a liquid (internally), hold it a minute so that it calms down, and then let go, it will stay that way, but if we take a solid and push it, like shearing a piece of “Jello,” and let it go, it flies back and starts a shear wave, travelling in the same way the compressions travel. In all cases, the shear wave speed is less than the speed of longitudinal waves. The shear waves are somewhat more analogous, so far as their polarizations are concerned, to light waves. Sound has no polarization; it is just a pressure wave. Light has a characteristic orientation perpendicular to its direction of travel.
In a solid, the waves are of both kinds. First, there is a compression wave, analogous to sound, that runs at one speed. If the solid is not crystalline, then a shear wave polarized in any direction will propagate at a characteristic speed. (Of course, all solids are crystalline, but if we use a block made up of microcrystals of all orientations, the crystal anisotropies average out.)
Another interesting question concerning sound waves is the following: What happens if the wavelength in a solid gets shorter, and shorter, and shorter? How short can it get? It is interesting that it cannot get any shorter than the space between the atoms, because if there is supposed to be a wave in which one point goes up and the next down, etc., the shortest possible wavelength is clearly the atom spacing. In terms of the modes of oscillation, we say that there are longitudinal modes, and transverse modes, long wave modes, short wave modes. As we consider wavelengths comparable to the spacing between the atoms, then the speeds are no longer constant; there is a dispersion effect where the velocity is not independent of the wave number. But, ultimately, the highest mode of transverse waves would be that in which every atom is doing the opposite of neighboring atoms.
Now from the point of view of atoms, the situation is like the two pendulums that we were talking about, for which there are two modes, one in which they both go together, and the other in which they go apart. It is possible to analyze the solid waves another way, in terms of a system of coupled harmonic oscillators, like an enormous number of pendulums, with the highest mode such that they oscillate oppositely, and lower modes with different relationships of the timing.
The shortest wavelengths are so short that they are not usually available technically. However, they are of great interest because, in the theory of thermodynamics of a solid, the heat properties of a solid, for example specific heats, can be analyzed in terms of the properties of the short sound waves. Going to the extreme of sound waves of ever shorter wavelength, one necessarily comes to the individual motions of the atoms; the two things are the same ultimately.
A very interesting example of sound waves in a solid, both longitudinal and transverse, are the waves that are in the solid earth. Who makes the noises we do not know, but inside the earth, from time to time, there are earthquakes—some rock slides past some other rock. That is like a little noise. So waves like sound waves start out from such a source very much longer in wavelength than one usually considers in sound waves, but still they are sound waves, and they travel around in the earth. The earth is not homogeneous, however, and the properties, of pressure, density, compressibility, and so on, change with depth, and therefore the speed varies with depth. Then the waves do not travel in straight lines—there is a kind of index of refraction and they go in curves. The longitudinal waves and the transverse waves have different speeds, so there are different solutions for the different speeds. Therefore, if we place a seismograph at some location and watch the way the thing jiggles after there has been an earthquake somewhere else, then we do not just get an irregular jiggling. We might get a jiggling, and a quieting down, and then another jiggling—what happens depends upon the location. If it were close enough, we would first receive longitudinal waves from the disturbance, and then, a few moments later, transverse waves, because they travel more slowly. By measuring the time difference between the two, we can tell how far away the earthquake is, if we know enough about the speeds and composition of the interior regions involved.

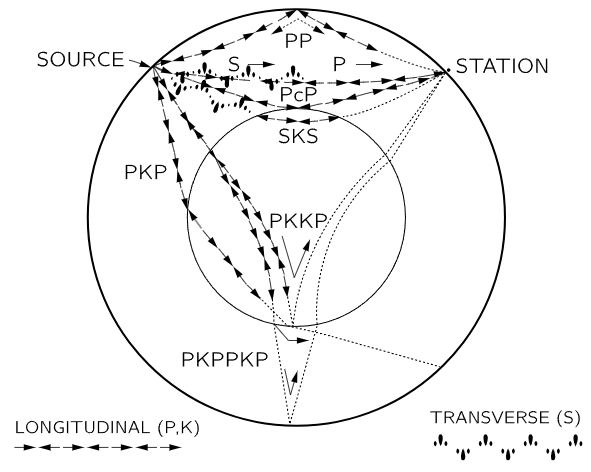
Fig. 51–6. Schematic of the earth, showing paths of longitudinal and transverse sound waves.
An example of the behavior pattern of waves in the earth is shown in Fig. 51–6. The two kinds of waves are represented by different symbols. If there were an earthquake at the place marked “source,” the transverse waves and longitudinal waves would arrive at different times at the station by the most direct routes, and there would also be reflections at discontinuities, resulting in other paths and times. It turns out that there is a core in the earth which does not carry transverse waves. If the station is opposite the source, transverse waves still arrive, but the timing is not right. What happens is that the transverse wave comes to the core, and whenever the transverse waves come to a surface which is oblique, between two materials, two new waves are generated, one transverse and one longitudinal. But inside the core of the earth, a transverse wave is not propagated (or at least, there is no evidence for it, only for a longitudinal wave); it comes out again in both forms and comes to the station.
It is from the behavior of these earthquake waves that it has been determined that transverse waves cannot be propagated within the inner circle. This means that the center of the earth is liquid in the sense that it cannot propagate transverse waves. The only way we know what is inside the earth is by studying earthquakes. So, by using a large number of observations of many earthquakes at different stations, the details have been worked out—the speed, the curves, etc. are all known. We know what the speeds of various kinds of waves are at every depth. Knowing that, therefore, it is possible to figure out what the normal modes of the earth are, because we know the speed of propagation of sound waves—in other words, the elastic properties of both kinds of waves at every depth. Suppose the earth were distorted into an ellipsoid and let go. It is just a matter of superposing waves travelling around in the ellipsoid to determine the period and shapes in a free mode. We have figured out that if there is a disturbance, there are a lot of modes, from the lowest, which is ellipsoidal, to higher modes with more structure.

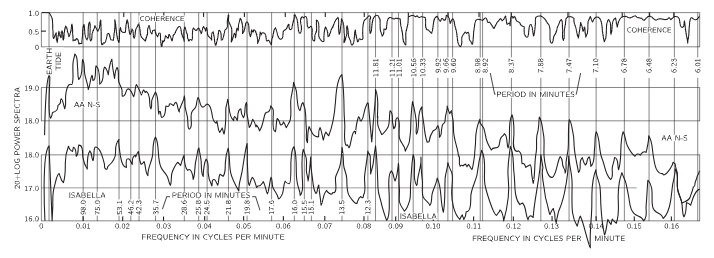
Fig. 51–7. Power versus frequency as detected at seismographs in Ñaña, Peru, and Isabella, California. The coherence is a measure of the coupling between the stations. [From Benioff, Press and Smith, J. Geoph. Research 66, 605 (1961)].
The Chilean earthquake of May 1960 made a loud enough “noise” that the signals went around the earth many times, and new seismographs of great delicacy were made just in time to determine the frequencies of the fundamental modes of the earth and to compare them with the values that were calculated from the theory of sound with the known velocities, as measured from the independent earthquakes. The result of this experiment is illustrated in Fig. 51–7, which is a plot of the strength of the signal versus the frequency of its oscillation (a Fourier analysis). Note that at certain particular frequencies there is much more being received than at other frequencies; there are very definite maxima. These are the natural frequencies of the earth, because these are the main frequencies at which the earth can oscillate. In other words, if the entire motion of the earth is made up of many different modes, we would expect to obtain, for each station, irregular bumping which indicate a superposition of many frequencies. If we analyze this in terms of frequencies, we should be able to find the characteristic frequencies of the earth. The vertical dark lines in the figure are the calculated frequencies, and we find a remarkable agreement, an agreement due to the fact that the theory of sound is right for the inside of the earth.

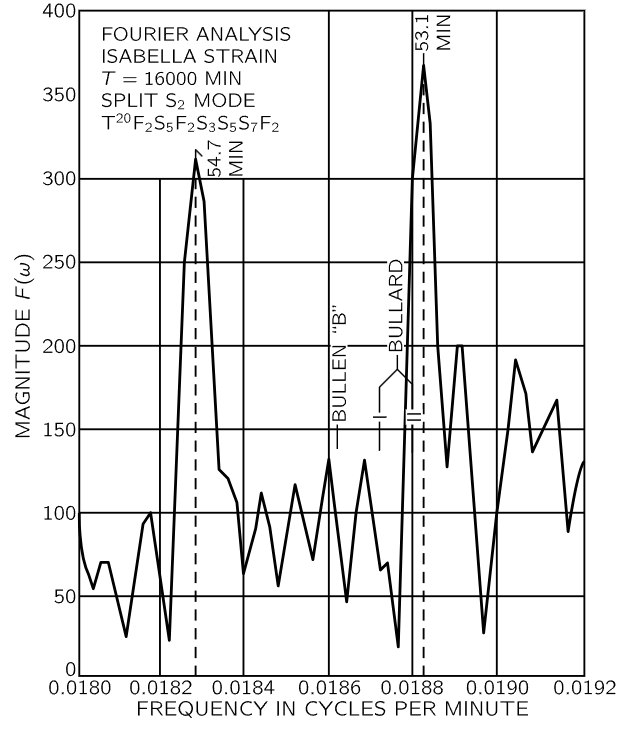
Fig. 51–8. High-resolution analysis of one of the seismograph records, showing spectral doublet.
A very curious point is revealed in Fig. 51–8, which shows a very careful measurement, with better resolution of the lowest mode, the ellipsoidal mode of the earth. Note that it is not a single maximum, but a double one, 54.7 minutes and 53.1 minutes—slightly different. The reason for the two different frequencies was not known at the time that it was measured, although it may have been found in the meantime. There are at least two possible explanations: One would be that there may be asymmetry in the earth’s distribution, which would result in two similar modes. Another possibility, which is even more interesting, is this: Imagine the waves going around the earth in two directions from the source. The speeds will not be equal because of effects of the rotation of the earth in the equations of motion, which have not been taken into account in making the analysis. Motion in a rotating system is modified by Coriolis forces, and these may cause the observed splitting.
Regarding the method by which these quakes have been analyzed, what is obtained on the seismograph is not a curve of amplitude as a function of frequency, but displacement as a function of time, always a very irregular tracing. To find the amount of all the different sine waves for all different frequencies, we know that the trick is to multiply the data by a sine wave of a given frequency and integrate, i.e., average it, and in the average all other frequencies disappear. The figures were thus plots of the integrals found when the data were multiplied by sine waves of different cycles per minute, and integrated.


|
|
|
|
دراسة تحدد أفضل 4 وجبات صحية.. وأخطرها
|
|
|
|
|
|
|
جامعة الكفيل تحتفي بذكرى ولادة الإمام محمد الجواد (عليه السلام)
|
|
|