

 علم الكيمياء
 الكيمياء التحليلية
 الكيمياء الحياتية
 الكيمياء العضوية
 الكيمياء الفيزيائية
 الكيمياء اللاعضوية
 مواضيع اخرى في الكيمياء
 الكيمياء الصناعية
 |
Read More
Date: 25-9-2018
Date: 15-1-2017
Date: 28-9-2018
|
Analysis of Concentration vs. Time Data
Another way of determining a reaction order is to carry out a reaction with all reactants but one at high concentrations which change very little as the low-concentration reactant is consumed. The changing concentration is measured from time to time. In effect, the rate depends only on the changing concentration since all others are nearly constant. Thus the rate can be expressed as:
 (1.1)
(1.1)
where k', which includes the true rate constant k and all the other, nearly constant, concentrations, raised to the appropriate power, is called a pseudo-a-order rate constant. Using the methods of integral calculus, it can be shown that the time dependence of [A] is:
 (1.2)
(1.2)
 (1.3)
(1.3)
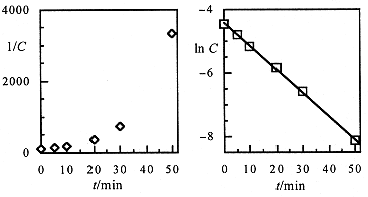
Thus a plot of [A]1-a or In [A] vs. time should give a straight line. The plot resulting in a straight line determines the order in A, and the slope of the line is (a - 1) k' or -k'.
Example 1
At a certain elevated temperature, the following reaction occurs:

The following data were obtained in a rate experiment:

Determine the order of the reaction in CH3CH2Cl.
Plots of In [CH3CH2Cl] and 1/[CH3CH2Cl] vs t are shown in Figure 1.1. The log plot is clearly much more linear than the reciprocal plot. Thus we conclude that the reaction is first-order in CH3CH2Cl. The slope of the straight line gives the rate constant k = 0.073 min-1. In this case, there is no other species at high concentration, so the rate law is:

Figure 1.1. Second- and first-order plots for data of Example 1.


|
|
|
|
دراسة تحدد أفضل 4 وجبات صحية.. وأخطرها
|
|
|
|
|
|
|
قسم الشؤون الفكرية يصدر كتاب الفلسفة الغربية برؤية الشيخ مرتضى مطهري
|
|
|