آخر المواضيع المضافة

 الفيزياء الكلاسيكية
الكهربائية والمغناطيسية
علم البصريات
الفيزياء الحديثة
النظرية النسبية
الفيزياء النووية
فيزياء الحالة الصلبة
الليزر
علم الفلك
المجموعة الشمسية
الطاقة البديلة
الفيزياء والعلوم الأخرى
مواضيع عامة في الفيزياء
الفيزياء الكلاسيكية
الكهربائية والمغناطيسية
علم البصريات
الفيزياء الحديثة
النظرية النسبية
الفيزياء النووية
فيزياء الحالة الصلبة
الليزر
علم الفلك
المجموعة الشمسية
الطاقة البديلة
الفيزياء والعلوم الأخرى
مواضيع عامة في الفيزياء| Mixing |


|
|
Read More
Date: 12-5-2021
Date: 20-4-2021
Date: 12-5-2021
|
Mixing
When two waves having different frequencies are combined in a nonlinear circuit, new frequencies are produced. These new waves are at the sum and difference frequencies of the original waves. You’ve probably noticed this mixing, also called heterodyning, if you’ve ever heard two loud, sine wave tones at the same time.
Suppose there are two signals with frequencies fl and f2. For mathematical convenience, assign f2 to the wave with the higher frequency. If these signals are combined in a nonlinear circuit, new waves will result. One of them will have a frequency f2 − fl, and the other will be at f2 + f1. These are known as beat frequencies. The signals are called mixing products (Fig. 1).
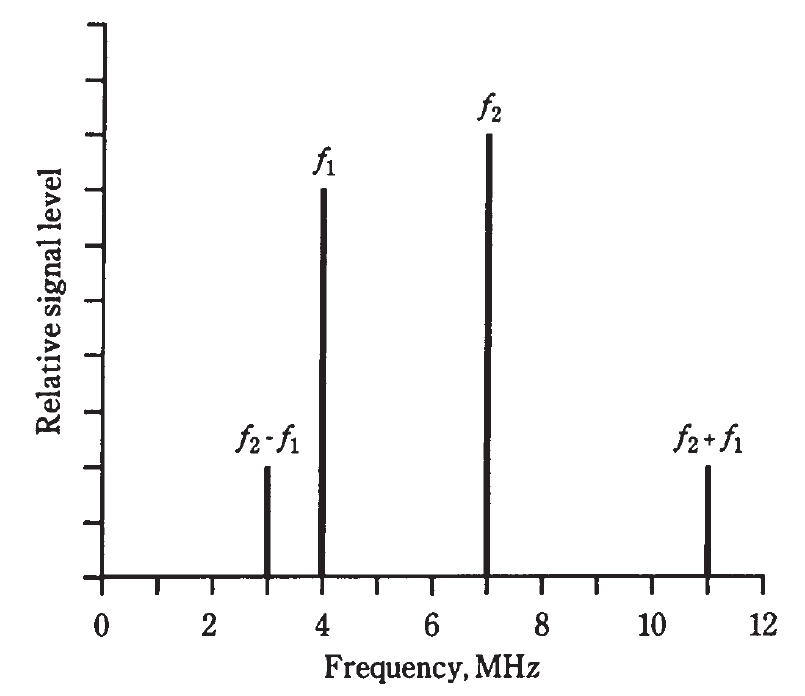
Fig. 1: Spectral (frequency-domain) illustration of mixing. Frequency designators are discussed in the text.
Figure 1 is a frequency domain graph. Amplitude (on the vertical scale) is shown as a function of frequency (on the horizontal scale). This kind of display is what engineers see when they look at the screen of a spectrum analyzer. Most of the graphs you’ve seen so far have been time domain graphs, in which things are shown as a function of time. The screen of an oscilloscope normally shows things in the time domain. How do you get the nonlinearity necessary to obtain a mixer circuit? There are various different schemes, but one common way is—you guessed it—to use diodes.


|
|
|
|
حقن الذهب في العين.. تقنية جديدة للحفاظ على البصر ؟!
|
|
|
|
|
|
|
"عراب الذكاء الاصطناعي" يثير القلق برؤيته حول سيطرة التكنولوجيا على البشرية ؟
|
|
|
|
|
|
|
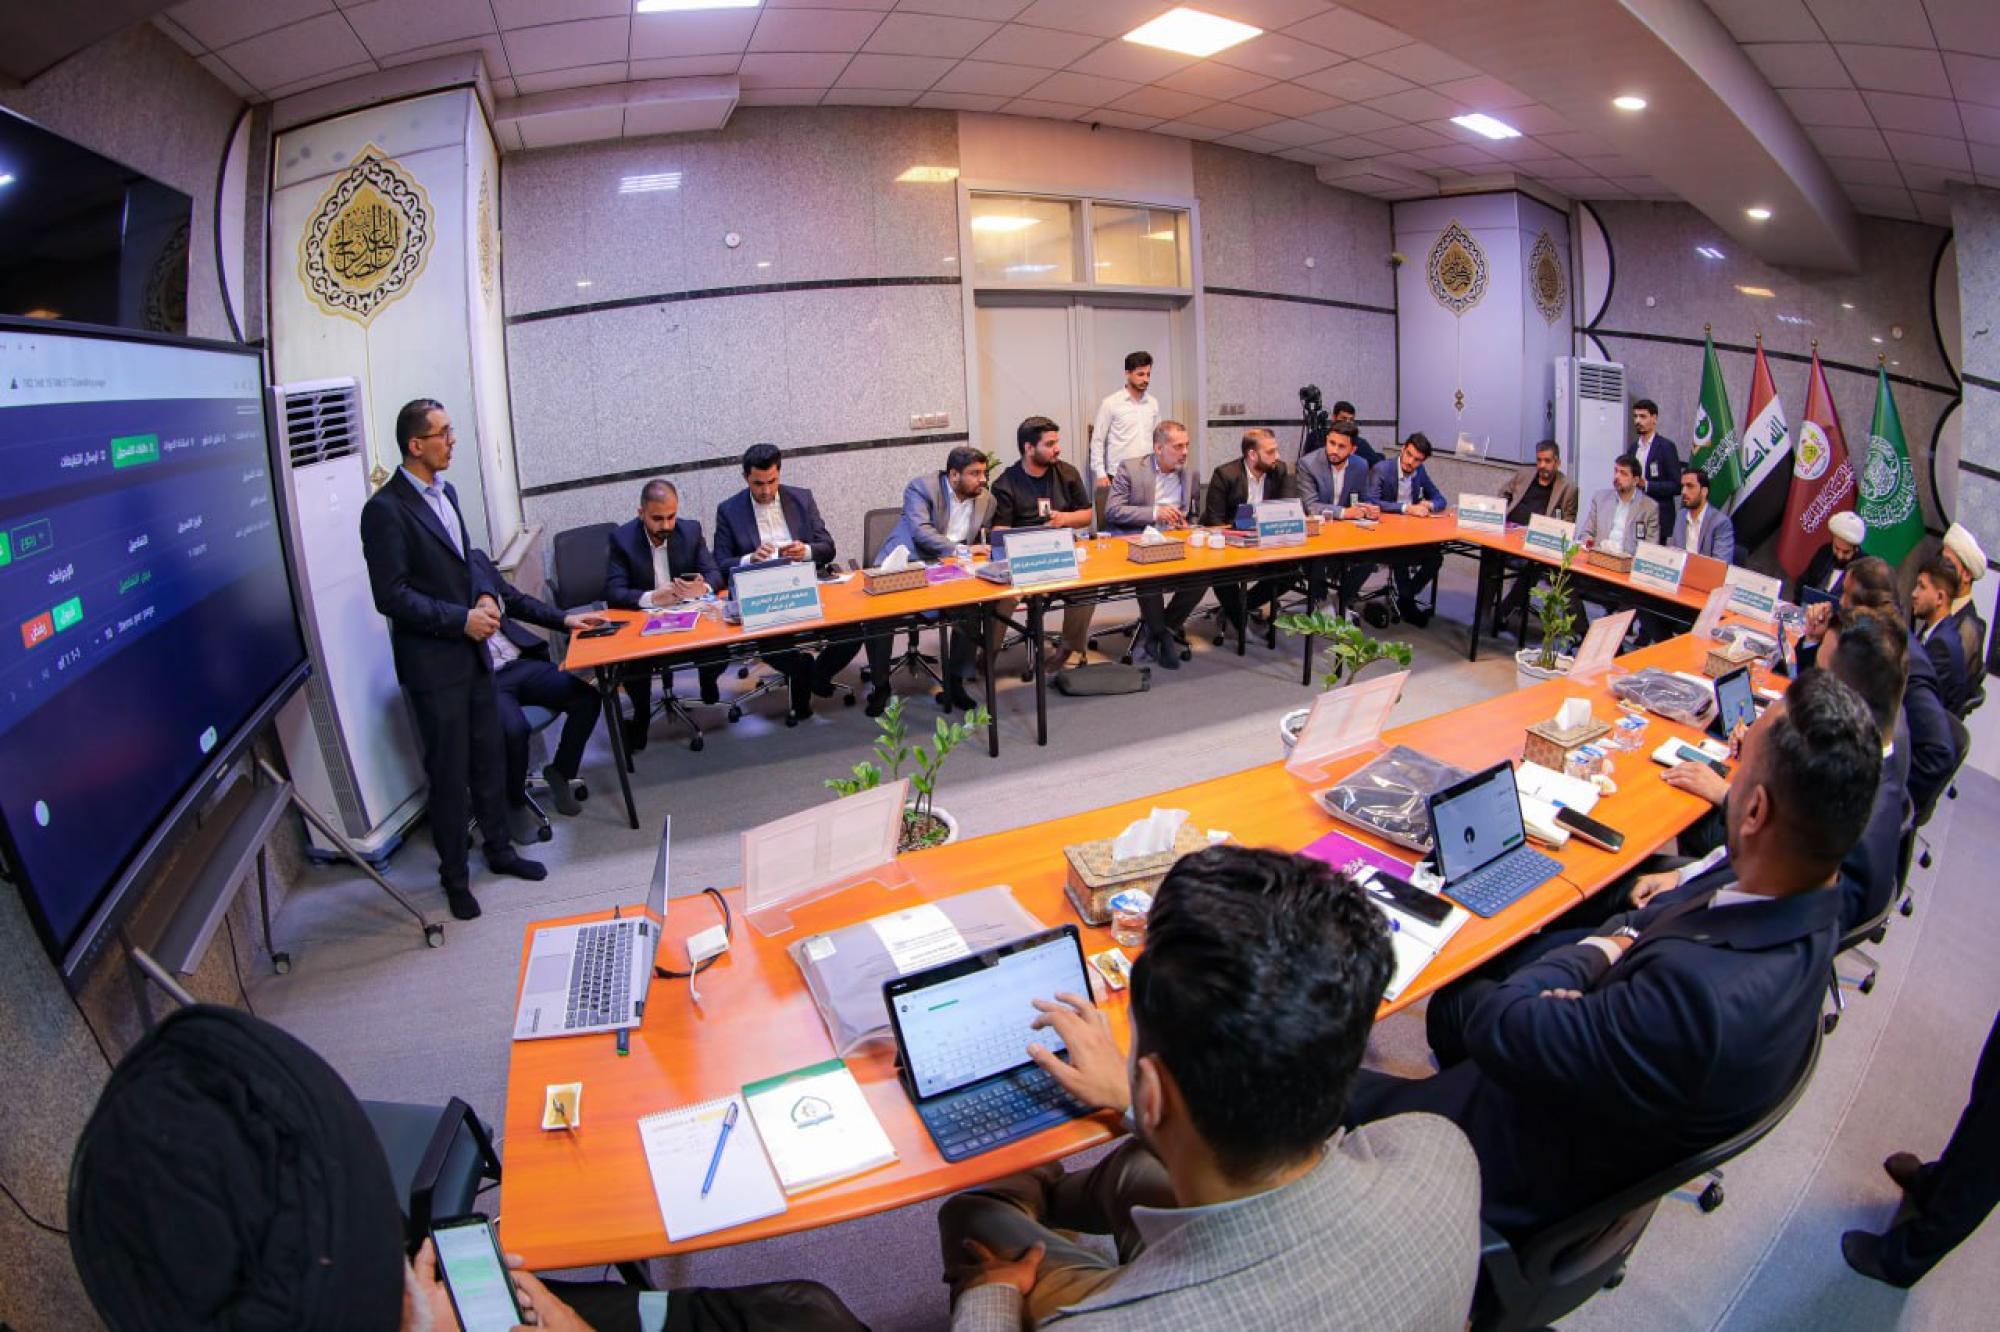
المجمع العلمي يعقد اجتماعاً لمناقشة إطلاق مشروع الدورات القرآنيّة الصيفيّة
|
|
|