Beat notes and modulation
 المؤلف:
Richard Feynman, Robert Leighton and Matthew Sands
 المصدر:
The Feynman Lectures on Physics
 الجزء والصفحة:
Volume I, Chapter 48
 2024-06-15
 1596
1596
If we are now asked for the intensity of the wave of Eq. (48.7), we can either take the absolute square of the left side, or of the right side. Let us take the left side. The intensity then is

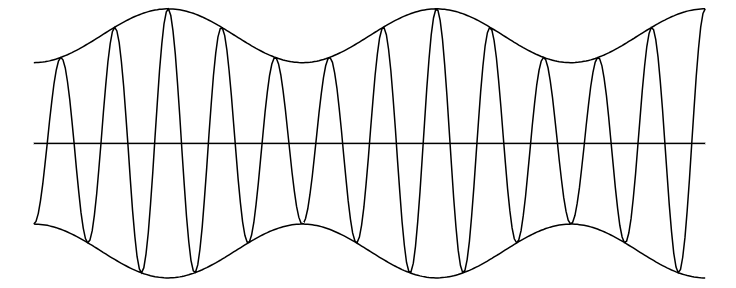
We see that the intensity swells and falls at a frequency ω1−ω2, varying between the limits (A1+A2)2 and (A1−A2)2. If A1≠A2, the minimum intensity is not zero.

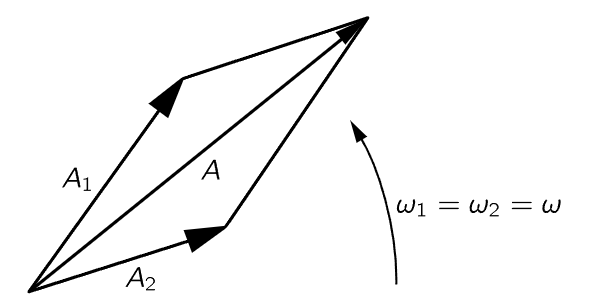
Fig. 48–2. The resultant of two complex vectors of equal frequency.
One more way to represent this idea is by means of a drawing, like Fig. 48–2. We draw a vector of length A1, rotating at a frequency ω1, to represent one of the waves in the complex plane. We draw another vector of length A2, going around at a frequency ω2, to represent the second wave. If the two frequencies are exactly equal, their resultant is of fixed length as it keeps revolving, and we get a definite, fixed intensity from the two. But if the frequencies are slightly different, the two complex vectors go around at different speeds. Figure 48–3 shows what the situation looks like relative to the vector A1eiω1t. We see that A2 is turning slowly away from A1, and so the amplitude that we get by adding the two is first strong, and then, as it opens out, when it gets to the 180∘ relative position the resultant gets particularly weak, and so on. As the vectors go around, the amplitude of the sum vector gets bigger and smaller, and the intensity thus pulsates. It is a relatively simple idea, and there are many different ways of representing the same thing.

Fig. 48–3. The resultant of two complex vectors of unequal frequency, as seen in the rotating frame of reference of one vector. Nine successive positions of the slowly rotating vector are shown.
The effect is very easy to observe experimentally. In the case of acoustics, we may arrange two loudspeakers driven by two separate oscillators, one for each loudspeaker, so that they each make a tone. We thus receive one note from one source and a different note from the other source. If we make the frequencies exactly the same, the resulting effect will have a definite strength at a given space location. If we then de-tune them a little bit, we hear some variations in the intensity. The farther they are de-tuned, the more rapid are the variations of sound. The ear has some trouble following variations more rapid than ten or so per second.
We may also see the effect on an oscilloscope which simply displays the sum of the currents to the two speakers. If the frequency of pulsing is relatively low, we simply see a sinusoidal wave train whose amplitude pulsates, but as we make the pulsations more rapid we see the kind of wave shown in Fig. 48–1. As we go to greater frequency differences, the “bumps” move closer together. Also, if the amplitudes are not equal and we make one signal stronger than the other, then we get a wave whose amplitude does not ever become zero, just as we expect. Everything works the way it should, both acoustically and electrically.
The opposite phenomenon occurs too! In radio transmission using so-called amplitude modulation (am), the sound is broadcast by the radio station as follows: the radio transmitter has an ac electric oscillation which is at a very high frequency, for example 800 kilocycles per second, in the broadcast band. If this carrier signal is turned on, the radio station emits a wave which is of uniform amplitude at 800,000 oscillations a second. The way the “information” is transmitted, the useless kind of information about what kind of car to buy, is that when somebody talks into a microphone the amplitude of the carrier signal is changed in step with the vibrations of sound entering the microphone.

Fig. 48–4. A modulated carrier wave. In this schematic sketch, ωc/ωm=5. In an actual radiowave, ωc/ωm∼100.
If we take as the simplest mathematical case the situation where a soprano is singing a perfect note, with perfect sinusoidal oscillations of her vocal cords, then we get a signal whose strength is alternating as shown in Fig. 48–4. The audiofrequency alternation is then recovered in the receiver; we get rid of the carrier wave and just look at the envelope which represents the oscillations of the vocal cords, or the sound of the singer. The loudspeaker then makes corresponding vibrations at the same frequency in the air, and the listener is then essentially unable to tell the difference, so they say. Because of a number of distortions and other subtle effects, it is, in fact, possible to tell whether we are listening to a radio or to a real soprano; otherwise the idea is as indicated above.
 الاكثر قراءة في الفيزياء العامة
 اخر الاخبار
اخبار العتبة العباسية المقدسة


